Publication Cover
Molecular Physics
An International Journal at the Interface Between Chemistry and Physics
Volume 112, 2014 - Issue 13
867
Views
5
CrossRef citations to date
0
Altmetric
Research Article

A spectroscopic investigation of the ionisation and dissociation decay dynamics of Rydberg states of NO

, , , , &
Pages 1808-1815 | Received 21 Sep 2013, Accepted 08 Nov 2013, Published online: 24 Jan 2014

Figures & data

Figure 1. A schematic diagram illustrating the excitation scheme employed in this work. A single photon (ω1) pumps the A2Σ+ ← X2Π3/2 transition and a second photon (ω2) scans through the Rydberg levels which may autoionise or predissociate. The dominant decay channel in the predissociation process is via the B2Π state to form N(2D) and O(3P) neutral products. This is probed by (2 + 1)REMPI of the nitrogen fragment via the N(2S) state. The products of the REMPI process and the autoionisation process are separated in a time of flight mass spectrometer and detected at a microchannel plate detector.

Figure 1. A schematic diagram illustrating the excitation scheme employed in this work. A single photon (ω1) pumps the A2Σ+ ← X2Π3/2 transition and a second photon (ω2) scans through the Rydberg levels which may autoionise or predissociate. The dominant decay channel in the predissociation process is via the B2Π state to form N(2D) and O(3P) neutral products. This is probed by (2 + 1)REMPI of the nitrogen fragment via the N(2S) state. The products of the REMPI process and the autoionisation process are separated in a time of flight mass spectrometer and detected at a microchannel plate detector.

Figure 2. Autoionising (lower trace) and predissociating (upper traces) spectra of Rydberg states populated via the states. The spectra are plotted as a function of binding energy relative to the ionisation potential of the dominant np(0) series in the spectrum. The dominant np(0), np(2) and nf(2) series are labelled by frequency combs that mark the unperturbed line positions, calculated using the Rydberg formula, as described in the text. Representative lineshapes obtained from the least squares fit of Equation (1) are plotted in red.

Figure 2. Autoionising (lower trace) and predissociating (upper traces) spectra of Rydberg states populated via the states. The spectra are plotted as a function of binding energy relative to the ionisation potential of the dominant np(0) series in the spectrum. The dominant np(0), np(2) and nf(2) series are labelled by frequency combs that mark the unperturbed line positions, calculated using the Rydberg formula, as described in the text. Representative lineshapes obtained from the least squares fit of Equation (1) are plotted in red.

Figure 3. Enlarged regions of the Rydberg spectra plotted over the range (a) −400 to −300 cm−1, (b) −300 to −200 cm−1 and (c) −200 to −100 cm−1. The dominant np(0), np(2) and nf(2) series are labelled by frequency combs that mark the unperturbed line positions, calculated using the Rydberg formula, as described in the text.

Figure 3. Enlarged regions of the Rydberg spectra plotted over the range (a) −400 to −300 cm−1, (b) −300 to −200 cm−1 and (c) −200 to −100 cm−1. The dominant np(0), np(2) and nf(2) series are labelled by frequency combs that mark the unperturbed line positions, calculated using the Rydberg formula, as described in the text.

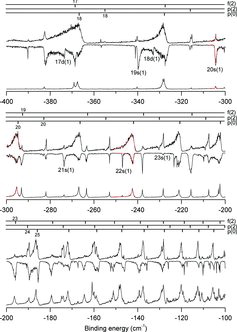
Table 1. Parameters derived for selected resonances from the np(0), np(2), ns(1) and nf(2) series from least squares fitting of Equation (1) to the experimental data.

Figure 4 Enlarged regions of the Rydberg spectra plotted over the range (a) −390 to −320 cm−1, (b) −205 to −200 cm−1 and (c) −180 to −130 cm−1. The υ+ = 1 autoionisation spectrum is plotted as a positive going trace above the υ+ = 1 predissociation spectrum. The dissociation spectrum mirrors the ionisation spectrum and is plotted as a negative going trace. The regions highlight specific resonances that cannot be fit to Equation (1) and show particularly unusual lineshapes and/or intensities. For more detail see text.

Figure 4 Enlarged regions of the Rydberg spectra plotted over the range (a) −390 to −320 cm−1, (b) −205 to −200 cm−1 and (c) −180 to −130 cm−1. The υ+ = 1 autoionisation spectrum is plotted as a positive going trace above the υ+ = 1 predissociation spectrum. The dissociation spectrum mirrors the ionisation spectrum and is plotted as a negative going trace. The regions highlight specific resonances that cannot be fit to Equation (1) and show particularly unusual lineshapes and/or intensities. For more detail see text.