Figures & data
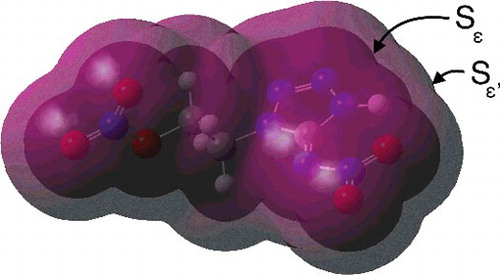
Figure 1. Surfaces of constant electron density for compound 1. The electron density on the outer surface is 0.0001 a.u., while it is 0.0040 a.u. on the inner. Both surfaces were computed with the B3LYP functional and a basis set of type 6-31G(d). The illustration was produced with the GaussView 4 software [Citation13].
![Figure 1. Surfaces of constant electron density for compound 1. The electron density on the outer surface is 0.0001 a.u., while it is 0.0040 a.u. on the inner. Both surfaces were computed with the B3LYP functional and a basis set of type 6-31G(d). The illustration was produced with the GaussView 4 software [Citation13].](/cms/asset/388996e0-d152-408d-8239-08a7ad23ee20/tmph_a_1140842_f0001_oc.jpg)
Table 2. Tolerances applied to identify points on the studied molecular surfaces.
Table 1. Overview of studied compounds, their ν and Π values on the surfaces ,
and
. The quantity Π is listed in units of Hartree, ν is dimensionless.
Figure 2. The parameter values of Π and σ on the isosurfaces ,
,
,
and
. Both Π and σ are given in units of Hartree.
Figure 3. The parameter values of ν and Θ on the isosurfaces ,
,
,
and
.
Figure 4. Left: the parameter values of s′ on the isosurfaces ,
,
,
and
. Right: the imbalance quantities Θ and ν.