Figures & data
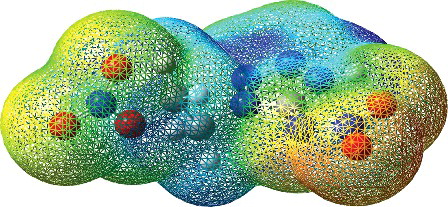
Figure 1. The electron density isosurface for compound 1 with the B3LYP functional. The illustration was produced with the GaussView 4.1 software [Citation29].
![Figure 1. The electron density isosurface for compound 1 with the B3LYP functional. The illustration was produced with the GaussView 4.1 software [Citation29].](/cms/asset/9dcade21-66be-49e8-8082-39f0eb4ea9af/tmph_a_1158420_f0001_oc.jpg)
Table 1. Model prediction errors (RMSEP). All volumes are given in units of cm3/mol.
Table 3. Fitted parameters for the enclosed volume estimates and the models including Π and σ corrections. The AICc values are listed with respect to the model the lowest value. The unit of β is cm3/(mol Hartree) and the unit of γ is cm3/mol.
Figure 2. Error distributions of the models. The M05 distributions are illustrated in dark grey, while those of B3LYP are light grey. The errors are given in cm3/mol.
Figure 3. The error of the enclosed volume estimates Vencl plotted against σ. Non-CHNO compounds are shown in dark grey, and CHNO compounds in light grey. The values of σ and Vencl were computed with the M05 functional and are given in units of Hartree and cm3/mol, respectively.
Figure 4. The values of plotted against the variation quantities σ2 (top) and
(bottom). All values are given in Hartree2.