Figures & data
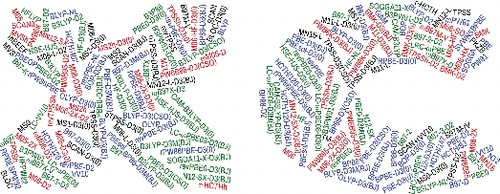
Figure 1. Perdew's metaphorical Jacob's Ladder, composed of five rungs corresponding to increasingly sophisticated models for the unknown exchange-correlation functional of DFT. Since each rung contains new physical content that is missing in lower rungs, improved accuracy should be attainable at each higher level. This is illustrated by reporting the average ranking of the best-performing functional from each rung out of the total of 200 functionals assessed later on in the review (which covers functionals occupying Rungs 1–4).

Table 1. Mean signed errors (MSE) and mean absolute deviations (MAD) in kcal/mol for Hartree–Fock (HF) and nine density functionals. Statistics for three distinct interaction types are provided: 124 single-reference atomisation energies (AE), 12 dispersion-bound (DB) alkane dimers, and 38 hydrogen-bonded (HB) water clusters (dimers through decamers).
Figure 2. Inhomogeneity correction factors (ICF) for a variety of GGA exchange functionals as a function of . The subfigure on the left contains exchange functionals with ICFs that are PBE-like, while the subfigure on the right contains exchange functionals with ICFs that differ substantially from the PBE form. The local density approximation is equivalent to a horizontal line at gx = 1.
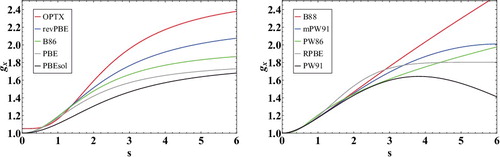
Figure 3. Inhomogeneity correction factors (ICF) for a variety of meta-GGA exchange functionals as a function of . The subfigure on the left plots the α = 0 limit (covalent bonds), while the subfigure on the right plots the α = ∞ limit (weak bonds). The local density approximation is equivalent to a horizontal line at gx = 1.
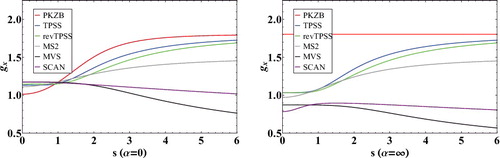
Figure 4. Exact exchange attenuation plots for various long-range corrected (ωB97X-D, CAM-B3LYP, LC-ωPBE, and M11), screened-exchange (HSE-HJS), and global hybrid (B3LYP and M06-2X) density functionals. As a point of reference, Hartree–Fock is equivalent to a horizontal line at y = 1.
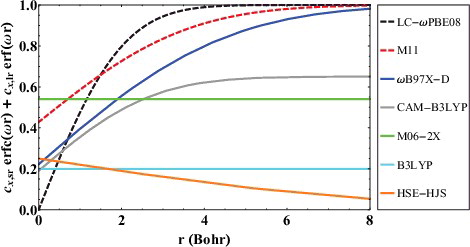
Figure 5. Stacked root-mean-square deviations (RMSD) in kcal/mol for a set of six local/hybrid functional pairs (e.g. BLYP/B3LYP). NCD contains 91 non-covalent interactions that are sensitive to electron delocalisation, ID contains 155 isomerisation energies that are sensitive to electron delocalisation, while BH contains 206 barrier heights. Section 4.1 provides a more complete description of NCD, ID, and BH. These 452 data points are representative of cases where the addition of a fraction of exact exchange should improve the performance of a local functional. For example, the performance of PBE is improved by about a factor of 2 upon the introduction of 25% exact exchange (PBE0).
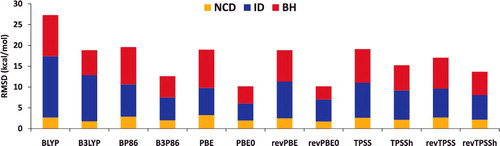
Figure 6. Log– log plot of the helium dimer potential energy curve with Hartree–Fock (HF) and revPBE, as well as their dispersion-corrected counterparts. The post-equilibrium portion of the curve (5.1 Å and larger) is displayed in order to demonstrate that the long range behaviour of the dispersion-corrected functionals is approximately R−6.
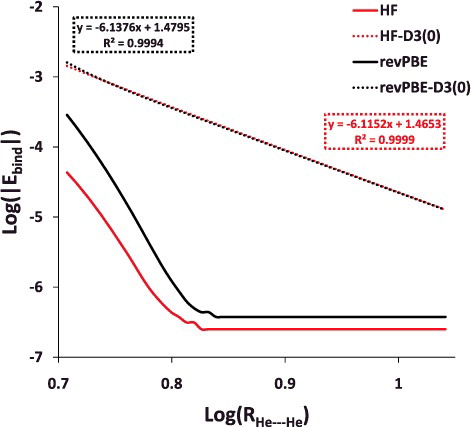
Figure 7. Stacked root-mean-square deviations (RMSD) in kcal/mol for four density functionals and their D2 and D3(BJ) dispersion-corrected counterparts. The four parent functionals are BLYP (local GGA), B3LYP (hybrid GGA), TPSS (local meta-GGA), and TPSSh (hybrid meta-GGA). NCED contains 1744 non-covalent dimer interactions and IE contains 755 isomerisation energies. Section 4.1 provides a more complete description of NCED and IE. These 2499 data points are representative of cases where dispersion corrections should be very effective. Indeed, the performance of B3LYP is greatly improved by the addition of the older D2 dispersion tail, and even further refined when D2 is replaced by D3(BJ).
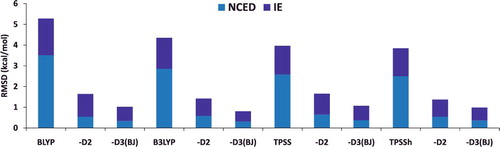
Figure 8. RMSD in kcal/mol for the 12 local and global hybrid Minnesota density functionals. SR contains 712 single-reference bonded interactions (124 atomisation energies, 505 heavy atom transfer reaction energies, and 83 bond dissociation energies), while MR contains 234 multi-reference bonded interactions (16 atomisation energies, 202 heavy atom transfer reaction energies, and 16 bond dissociation energies). The percentage of global exact exchange is displayed under the name of each functional. These 946 data points demonstrate the tradeoff between exact exchange and performance for single- and multi-reference interactions. For example, M06, with 27% exact exchange, performs equally well for SR and MR, while M06-2X, with 54% exact exchange, performs nearly 30% better than M06 for SR, but more than 30% worse than M06 for MR.
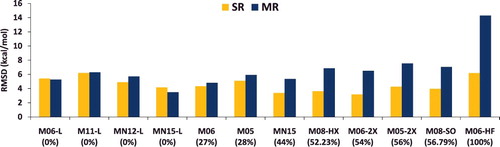
Figure 9. A graphical representation of elements that can be combined to define most existing density functionals. The circle contains the names of the 200 density functionals that are considered in this review, with the 20 featured functionals appearing in larger letters.
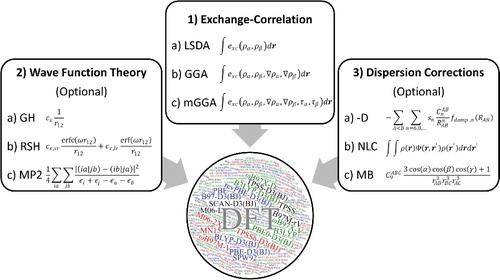
Figure 10. Ingredients that are conventionally used in the functional forms of semi-empirical density functionals. The primary GGA variable is the density gradient, ∇ρ, while the primary meta-GGA variable is the kinetic energy density, τ.
Figure 11. (Colour online) A visual depiction of parameter counting in semi-empirical density functionals. The middle (red) bars indicate the number of fitted parameters, while the right (blue) bars count the total number of borrowed or preset parameters. Furthermore, the left (black) bars that begin at zero and proceed left represent the number of constraints which subtract from the total number of fitted parameters. The values off to the right indicate the total number of fitted parameters (middle, red) minus the number of constraints (left, black), thus excluding borrowed or preset parameters. For example, ωB97X has 17 fitted parameters, 3 borrowed or preset parameters, and utilises 3 constraints, for a total of 14 parameters.
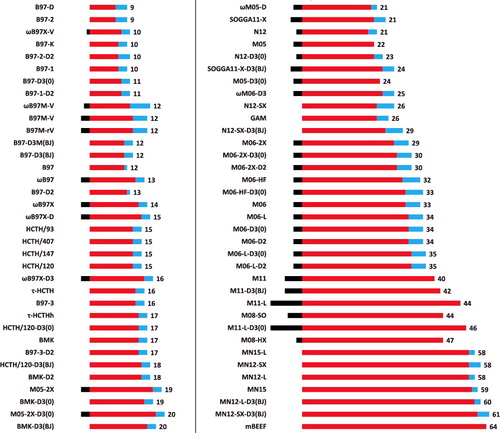
Figure 12. (Colour online) A visualisation of an (eighth-order meta-GGA) x (fourth-order GGA) functional space, which can be constructed by the two-dimensional power series in Equation (Equation13(13) ) with N′= 2N= 8. The three separate blocks (from left to right) contain exchange, same-spin correlation, and opposite-spin correlation coefficients, respectively. Different truncations of the parameter space are shown, with the red coefficients representing up to quadratic fits in all three components, the highlighted coefficients representing the GGA-only subspace, and the blue boxes representing third order in exchange and sixth/third order in the meta-GGA/GGA dimension in both correlation components.
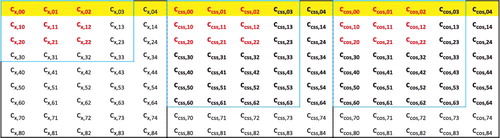
Table 2. Summary of the 84 data-sets that comprise MGCDB84. The datatypes are explained in Section 4.1. The fifth column contains the root-mean-squares of the data-set reaction energies. PEC stands for potential energy curve, SR stands for single-reference, MR stands for multi-reference, Bz stands for benzene, Me stands for methane, and Py stands for pyridine.
Table 2. Continued
Figure 13. Categorised list of the 200 benchmarked density functionals. The 20 highlighted functionals are featured in the paper and details regarding these functionals can be found in . Underlined functionals are range-separated hybrids. Italicised functionals are excluded from the box-and-whiskers plots in Section 5. The first level of separation pertains to hybridisation, the second level pertains to the density functional ingredients, and the third level pertains to the presence of dispersion corrections.
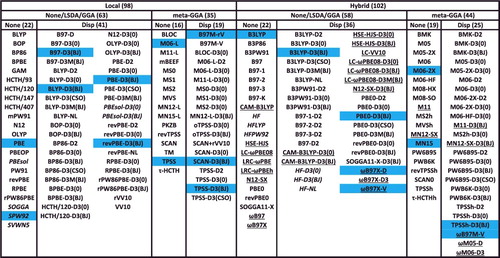
Table 3. Details for the 20 density functionals featured in the review, taken from the full list of 200 shown in . The second column lists the number of parameters, counted according to the strategy in . The third column indicates the percentage of exact exchange: a single, non-zero value indicates that the functional is a global hybrid (GH), while a range (e.g. 15–100) indicates that the functional is a range-separated hybrid (RSH), with the first value being the percentage of short-range exact exchange, and the second value being the percentage of long-range exact exchange (the value in parentheses is ω). The fourth column indicates the type of hybridisation. The fifth column indicates the ingredients (ρ, ∇ρ, and τ) contained in the functional. The sixth column indicates the type of dispersion correction, with D3(BJ) referring to Grimme's D3 method using the Becke– Johnson damping function, VV10 and rVV10 referring to the Vydrov and Van Voorhis nonlocal correlation functional and its revised version by Sabatini and co-workers, respectively, and CHG referring to the Grimme's D2 method using the Chai–Head–Gordon damping function.
Figure 14. Box-and-whisker plots for eight classes of density functionals, covering the three datatypes (NCED, NCEC, and IE) that are most sensitive to the inclusion of dispersion corrections. Each plot is generated from functional RMSDs (in kcal/mol) for the specified datatype. The eight plots together contain data for 188 of the 200 functionals benchmarked in this review (the italicised functionals in are excluded), with each plot containing (from left to right) 18, 39, 16, 19, 19, 33, 19, and 25 functional RMSDs, respectively.
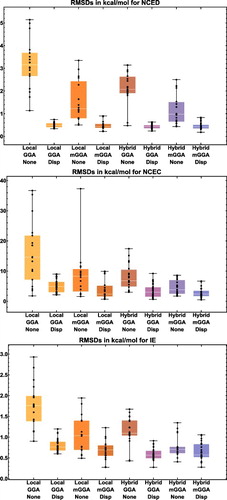
Figure 15. Box-and-whisker plots for eight classes of density functionals, covering the three datatypes (NCD, ID, and BH) that are most sensitive to the inclusion of exact exchange. Each plot is generated from functional RMSDs (in kcal/mol) for the specified datatype. The eight plots together contain data for 188 of the 200 functionals benchmarked in this review (the italicised functionals in are excluded), with each plot containing (from left to right) 18, 39, 16, 19, 19, 33, 19, and 25 functional RMSDs, respectively.
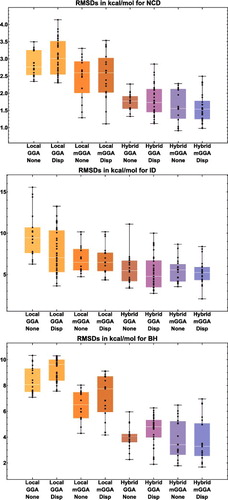
Figure 16. Box-and-whisker plots for eight classes of density functionals, covering the two datatypes (TCE and TCD) that are associated with bonded interactions. Each plot is generated from functional RMSDs (in kcal/mol) for the specified datatype. The eight plots together contain data for 188 of the 200 functionals benchmarked in this review (the italicised functionals in are excluded), with each plot containing (from left to right) 18, 39, 16, 19, 19, 33, 19, and 25 functional RMSDs, respectively.
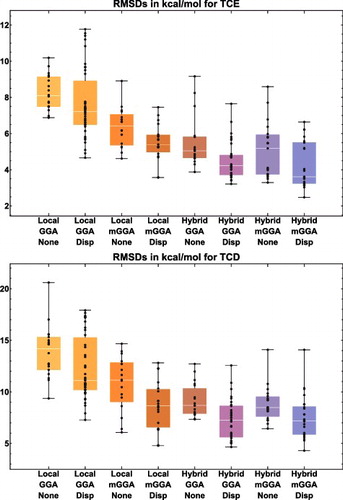
Figure 17. RMSDs in kcal/mol for the eight datatypes (as well as 81 equilibrium bond lengths (EBL in Ångström) and 81 equilibrium binding energies (EBE in kcal/mol)) for the 20 density functionals featured in this review, along with the minimum RMSD from across all 200 benchmarked functionals, and the name of the corresponding functional. The eight datatypes contain 1744, 243, 91, 755, 155, 947, 258, and 206 data points, respectively. NCED stands for non-covalent dimers (easy), NCEC stands for non-covalent clusters (easy), NCD stands for non-covalent dimers (difficult), IE stands for isomerisation energies (easy), ID stands for isomerisation energies (difficult), TCE stands for thermochemistry (easy), TCD stands for thermochemistry (difficult), and BH stands for barrier heights. ‘Difficult’ interactions involve either self-interaction error or strong correlation, while ‘easy’ interactions are not significantly characterised by either.
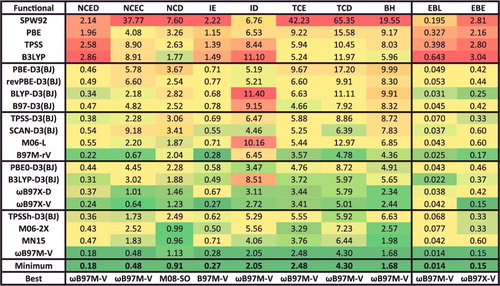
Figure 18. RMSDs in kcal/mol for the 18 data-sets that belong to the NCED datatype. Results for the 20 density functionals featured in this review are presented, along with the minimum RMSD from across all 200 benchmarked functionals, and the name of the corresponding functional. The 1744 interactions that are categorised as NCED are conventional, closed-shell, non-covalent dimers.
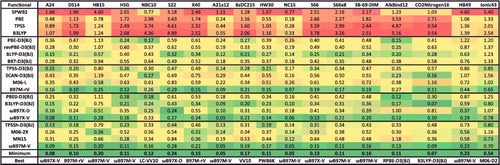
Figure 19. RMSDs in kcal/mol for the 12 data-sets that belong to the NCEC datatype. Results for the 20 density functionals featured in this review are presented, along with the minimum RMSD from across all 200 benchmarked functionals, and the name of the corresponding functional. The 243 interactions that are categorised as NCEC are conventional, closed-shell, non-covalent clusters.
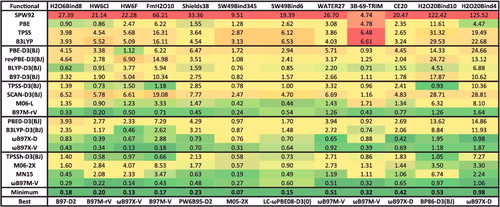
Figure 20. RMSDs in kcal/mol for the five data-sets that belong to the NCD datatype. Results for the 20 density functionals featured in this review are presented, along with the minimum RMSD from across all 200 benchmarked functionals, and the name of the corresponding functional. The 91 interactions that are categorised as NCD are either open-shell non-covalent dimers or non-covalent dimers characterised by significant electron delocalisation.
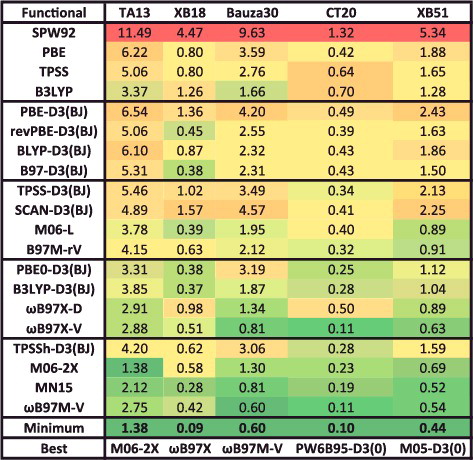
Figure 21. RMSDs for equilibrium bond lengths (EBL) in Ångström and equilibrium binding energies (EBE) in kcal/mol for four data-sets that contain potential energy curves. Results for the 20 density functionals featured in this review are presented, along with the minimum RMSD from across all 200 benchmarked functionals, and the name of the corresponding functional.
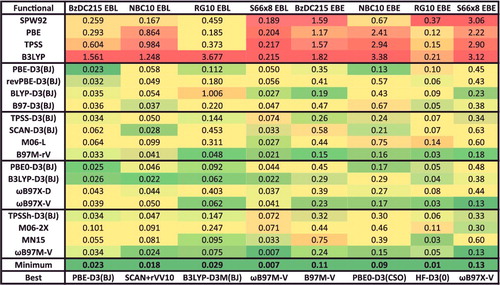
Figure 22. RMSDs in kcal/mol for the 12 data-sets that belong to the IE datatype. Results for the 20 density functionals featured in this review are presented, along with the minimum RMSD from across all 200 benchmarked functionals, and the name of the corresponding functional. The 755 interactions that are categorised as IE are conventional, closed-shell, isomerisation energies.
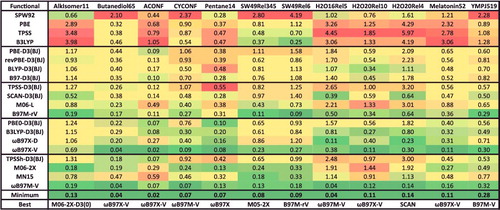
Figure 23. RMSDs in kcal/mol for the five data-sets that belong to the ID datatype. Results for the 20 density functionals featured in this review are presented, along with the minimum RMSD from across all 200 benchmarked functionals, and the name of the corresponding functional. The 155 interactions that are categorised as ID are isomerisation energies characterised by significant electron delocalisation.
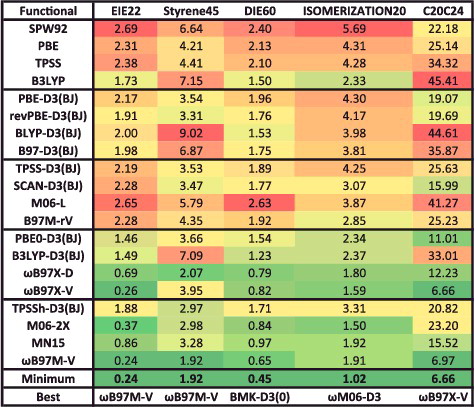
Figure 24. RMSDs in kcal/mol for the 15 data-sets that belong to the TCE datatype. Results for the 20 density functionals featured in this review are presented, along with the minimum RMSD from across all 200 benchmarked functionals, and the name of the corresponding functional. The 947 interactions that are categorised as TCE are conventional, single-reference bonded interactions.
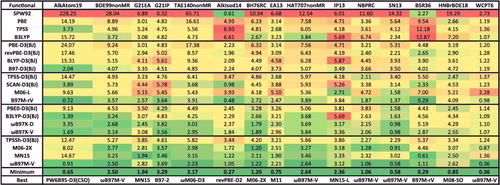
Figure 25. RMSDs in kcal/mol for the seven data-sets that belong to the TCD datatype. Results for the 20 density functionals featured in this review are presented, along with the minimum RMSD from across all 200 benchmarked functionals, and the name of the corresponding functional. The 258 interactions that are categorised as TCD are bonded interactions that are either very sensitive to self-interaction error or significantly multi-reference in nature.
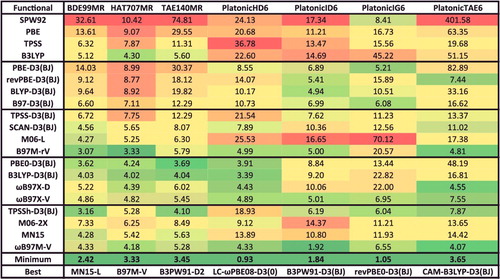
Figure 26. RMSDs in kcal/mol for the eight data-sets that belong to the BH datatype. Results for the 20 density functionals featured in this review are presented, along with the minimum RMSD from across all 200 benchmarked functionals, and the name of the corresponding functional. The 206 interactions that are categorised as BH are barrier heights.
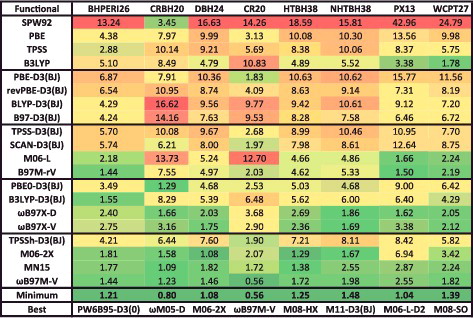
Figure 27. RMSDs in kcal/mol for PBE-D3(BJ), B3LYP-D3(BJ), and ωB97M-V for the eight datatypes (as well as 81 equilibrium bond lengths (EBL) in Ångström and 81 equilibrium binding energies (EBE) in kcal/mol) computed with four different basis sets: 6-31G*, def2-SVPD, def2-TZVPPD, and def2-QZVPPD. Results for the ‘low-cost’ PBEh-3c method by Grimme and co-workers are given in the last row, in order to demonstrate that if modern functionals are to be used with small basis sets like 6-31G*, it is better to use a method developed for use with a small basis set.
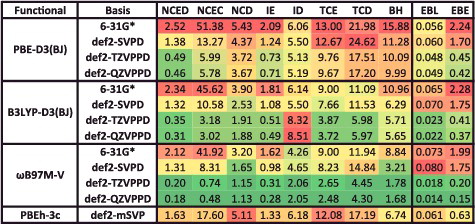
Figure 28. Mean absolute percent integration grid errors for 20 density functionals, relative to the 15 binding energies from the NC15 data-set computed with a (500,974) grid. A regularisation value of 0.01 kcal/mol is included in the denominator in order to cap excessively large percentage errors for very weakly bound systems. A value of 1% or smaller is deemed acceptable for these interactions.
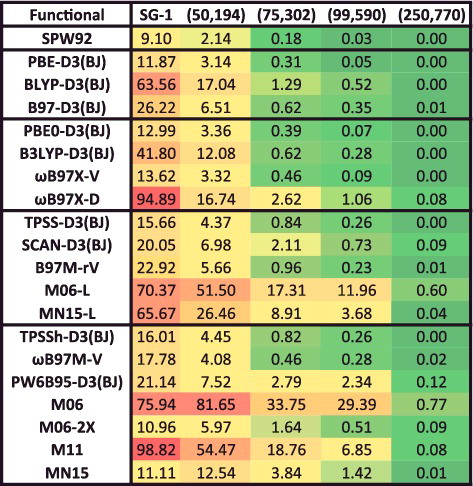
Figure 29. Root-mean-square integration grid errors in kcal/mol for 20 density functionals, relative to the 19 atomisation energies from the AlkAtom19 data-set computed with a (500,974) grid. A value of 0.05 kcal/mol or smaller is deemed acceptable for these interactions.
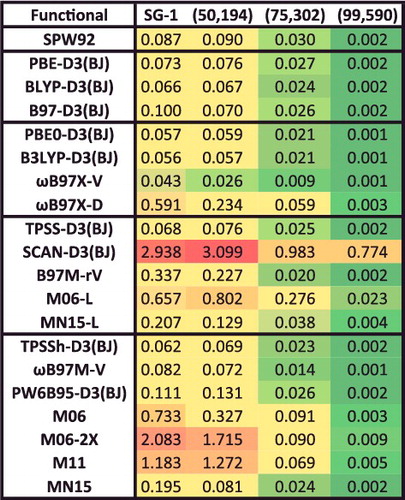
Figure 30. Benzene–neon dimer potential energy curves (PEC) computed with 20 density functionals with a (99,590) integration grid. The top subfigure shows LSDA, local GGA, and hybrid GGA functionals, and a majority of these functionals are converged with respect to the employed grid. The middle subfigure shows local meta-GGA functionals, while the bottom subfigure shows hybrid meta-GGA functionals. It is evident that the PECs of many of the meta-GGAs are sensitive to the integration grid.
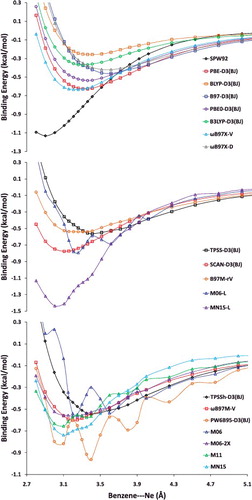
Figure 31. Visual representations of the three case studies considered in Section 7. The top panel corresponds to the Grubbs case study, the middle panel corresponds to the PDB12 case study, and the bottom panel corresponds to the Water2510 case study.
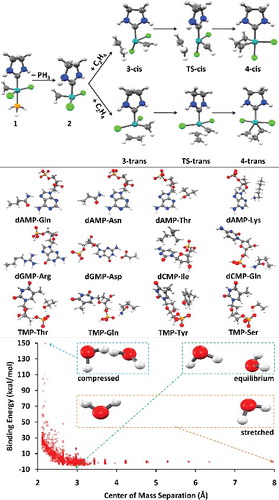
Figure 32. Relative energies in kcal/mol for the Grubbs case study for 13 density functionals. Mean signed errors (MSE) and root-mean-square deviations (RMSD) are shown at the bottom. The top panel of contains more information regarding these interactions.
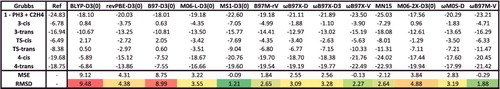
Figure 33. Binding energies in kcal/mol for the PDB12 case study for 13 density functionals. Mean signed errors (MSE) and root-mean-square deviations (RMSD) in kcal/mol are shown at the bottom. The middle panel of contains more information regarding these interactions.
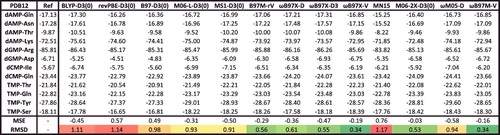
Figure 34. Mean signed errors (MSE) and root-mean-square deviations (RMSD) in kcal/mol for the Water2510 case study for 13 density functionals. The statistics are further separated into unbound configurations (E ≥ 0) and bound configurations (E < 0). The bottom panel of contains more information regarding these interactions.
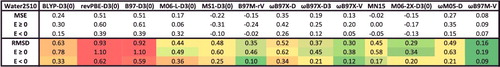
Figure 35. Sorted NCED RMSDs in kcal/mol for all 200 benchmarked density functionals. NCED contains 1744 non-covalent dimer interactions.
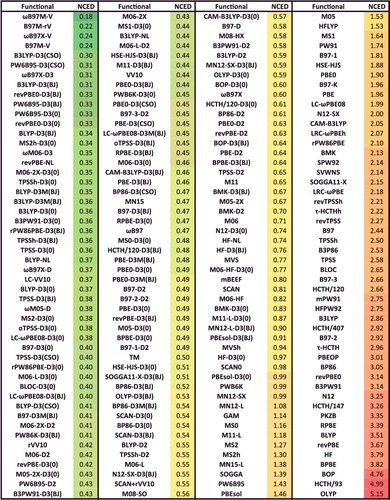
Figure 36. Sorted NCEC RMSDs in kcal/mol for all 200 benchmarked density functionals. NCEC contains 243 non-covalent cluster interactions.
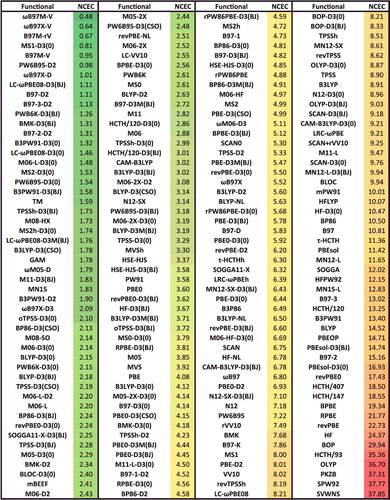
Figure 37. Sorted NCD RMSDs in kcal/mol for all 200 benchmarked density functionals. NCD contains 91 difficult non-covalent dimer interactions.
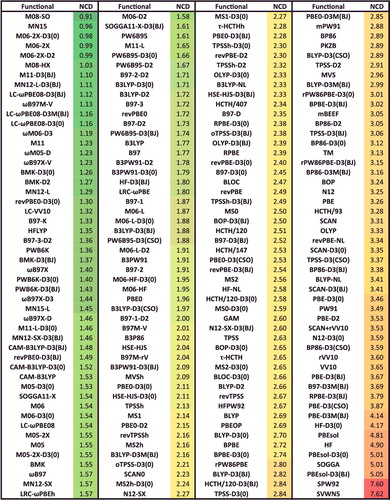
Figure 38. Sorted IE RMSDs in kcal/mol for all 200 benchmarked density functionals. IE contains 755 isomerisation energies.
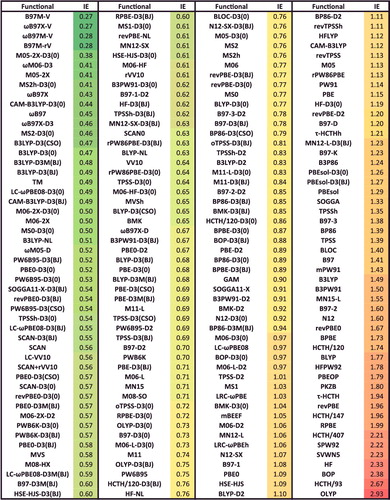
Figure 39. Sorted ID RMSDs in kcal/mol for all 200 benchmarked density functionals. ID contains 155 difficult isomerisation energies.
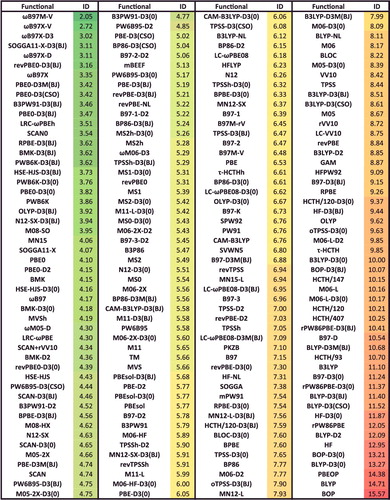
Figure 40. Sorted TCE RMSDs in kcal/mol for all 200 benchmarked density functionals. TCE contains 947 thermochemistry data points.
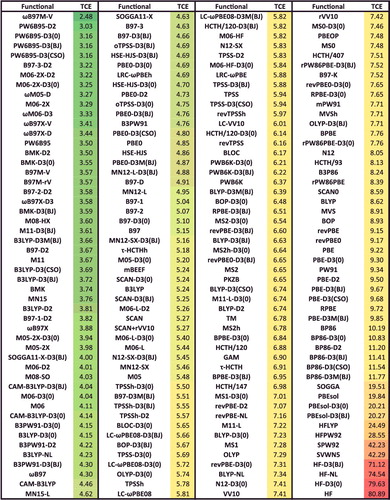
Figure 41. Sorted TCD RMSDs in kcal/mol for all 200 benchmarked density functionals. TCD contains 258 difficult thermochemistry data points.
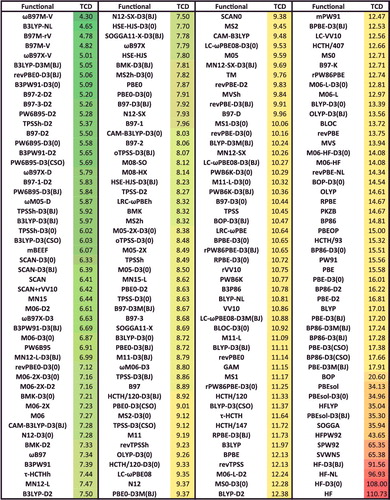
Figure 42. Sorted BH RMSDs in kcal/mol for all 200 benchmarked density functionals. BH contains 206 barrier heights.
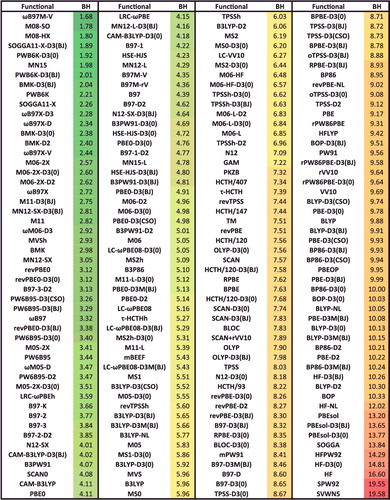
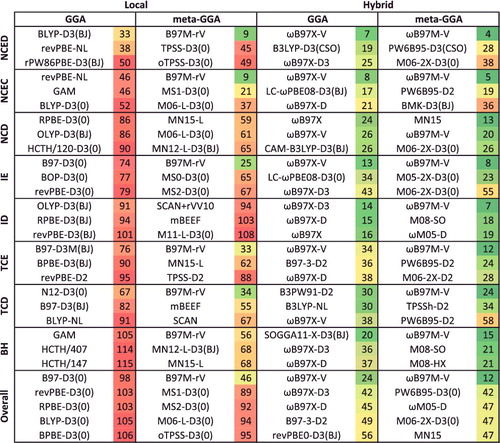
Figure 43. Average rankings for the best of the 200 functionals studied in this review. The functionals are ranked for each of the 82 data-sets that correspond to the eight datatypes, the rankings are averaged by datatype, and the functionals are partitioned by type (local/hybrid and GGA/mGGA). The three functionals with the best (smallest) rank populate the first eight rows of this table, and the last ‘Overall’ row is an average over the eight average datatype ranks. Functionals that differ only in their dispersion component are only listed once by selecting the best performer.