Figures & data
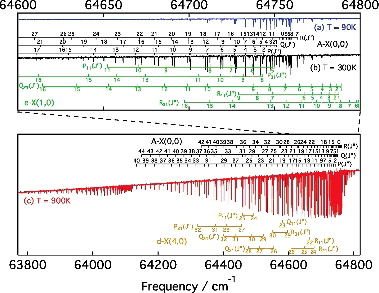
Figure 1. Recording of the R(2) two-photon transition in the A1Π − X1Σ+(0, 0) band of 12C18O measured by 2 + 1′ REMPI (red points and fitted black curve). The lower blue and black lines represent etalon markers and the saturated absorption spectrum of I2 used for frequency interpolation and calibration. The asterisk indicates the a13 (7,7) hyperfine component of the B-X (10,3) R(81) iodine line at 16 189.695 59 cm−1 [Citation34] that was used for calibration.
![Figure 1. Recording of the R(2) two-photon transition in the A1Π − X1Σ+(0, 0) band of 12C18O measured by 2 + 1′ REMPI (red points and fitted black curve). The lower blue and black lines represent etalon markers and the saturated absorption spectrum of I2 used for frequency interpolation and calibration. The asterisk indicates the a13 (7,7) hyperfine component of the B-X (10,3) R(81) iodine line at 16 189.695 59 cm−1 [Citation34] that was used for calibration.](/cms/asset/1d1358cf-1136-44cd-a372-43ec28b2cd44/tmph_a_1356477_f0001_oc.jpg)
Table 1. Rotational transition frequencies,1 νobs, the deviations between observed values and calculated values from a fit to the entire data set involving all laser, FT-emission and FT-absorption lines Δobs.-calc., and AC-Stark slope coefficient2, CAC, of A1Π − X1Σ+(0, 0) in 12C18O as measured in the 2 + 1′ REMPI laser experiment.
Figure 2. AC-Stark-plots for four transitions measured by two-photon Doppler-free spectroscopy in the A1Π − X1Σ+(0, 0) band of 12C18O.
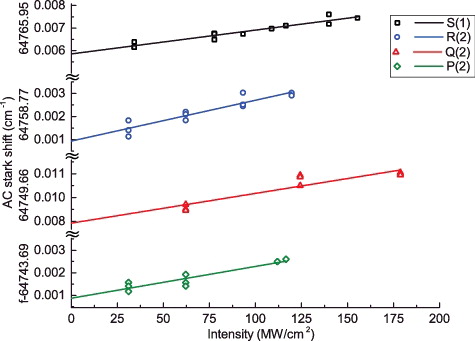
Figure 3. High resolution emission spectrum with rotational assignments of the 12C18O B1Σ+ − A1Π (0, 0), B1Σ+ − e3Σ− (0, 1), B1Σ+ − d3Δ (0, 4), and B1Σ+ − a′3Σ+ (0, 9) bands recorded with the VIS-FT spectrometer. Upper trace: experimental spectrum; Lower trace: simulation of 12C18O B1Σ+ − A1Π (0, 0) obtained with the Pgopher software [Citation41]. Lines indicated by red labels represent J-values with the strongest perturbations.
![Figure 3. High resolution emission spectrum with rotational assignments of the 12C18O B1Σ+ − A1Π (0, 0), B1Σ+ − e3Σ− (0, 1), B1Σ+ − d3Δ (0, 4), and B1Σ+ − a′3Σ+ (0, 9) bands recorded with the VIS-FT spectrometer. Upper trace: experimental spectrum; Lower trace: simulation of 12C18O B1Σ+ − A1Π (0, 0) obtained with the Pgopher software [Citation41]. Lines indicated by red labels represent J-values with the strongest perturbations.](/cms/asset/8bdeae7a-9c8d-4cc7-88aa-40f734bbf6aa/tmph_a_1356477_f0003_oc.jpg)
Table 2. Transition frequencies of the 12C18O B1Σ+ − A1Π (0, 0) band obtained in the VIS-FTS experiment.1
Table 3. Spin-forbidden lines appearing in the VIS-FT absorption spectra.1
Figure 4. Spectra of the A−X(0, 0) band, and perturbing e3Σ− − X1Σ+(1,0) and d3Δ − X1Σ+(4,0) bands, recorded with the VUV-FT spectrometer at the SOLEIL synchrotron for three different sample temperatures, T = 90 K, T = 300 K and T = 900 K, as indicated.
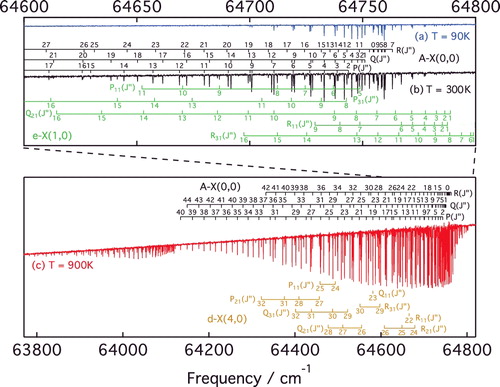
Table 4. Transition frequencies of A1Π − X1Σ+(0, 0) from the VUV-FT experiment.1
Table 5. Spin-forbidden lines arising in the VUV-FT absorption spectra.1
Figure 5. Intensity sharing between A1Π − X1Σ+(0, 0) and overlapping bands. Band f-values for all transitions were calculated assuming the Hönl-London factors for a 1Π − 1Σ+ transition. Points / error bars: experimental data (circles: P/Q branches, triangles: R branch). Lines: Results of the deperturbation model.
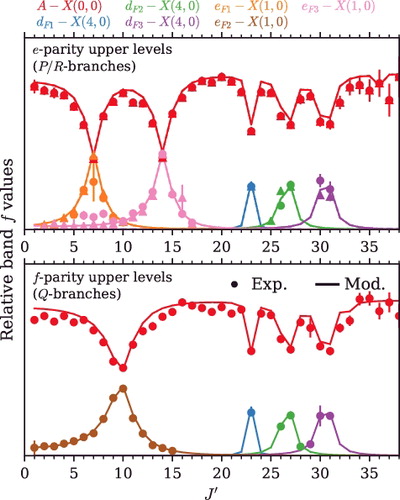
Figure 6. Photoabsorption spectrum of B1Σ+ − X1Σ+(0, 0) band with a sample temperature of 1000 ± 100 K. The B−X(1, 1) band also appears due to the higher temperature. The overall intensity slope is due to the continuum profile of the synchrotron beam. Also shown is the residual difference of the experimental spectrum and its modelled profile. Residuals are plotted on the same scale as the spectrum.
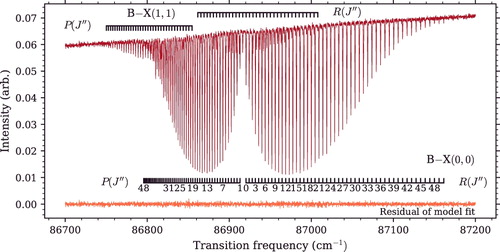
Table 6. Transition frequencies of B1Σ+ − X1Σ+(0, 0) in 12C18O from the VUV-FT experiment.1
Figure 7. Reduced term values (in cm−1) of the 12C18O A1Π (v = 0) level and the perturbing rovibronic levels.
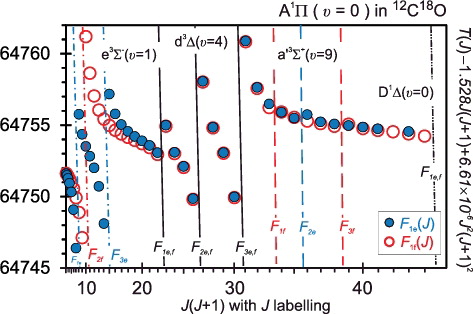
Table 7. Deperturbed molecular parameters of 12C18O for the A(0) state and its perturbers, and B(0).a, b Perturbation parameters as discussed in Refs. [Citation25,Citation29].
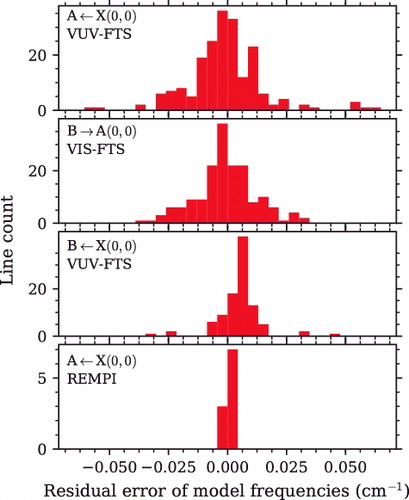
Figure 8. Residual error of modelled line frequencies after deperturbation, shown separately for each experimental measurement. The histograms consist of residuals for the main bands and all observed extra lines.