
Figures & data

Figure 1. Chemical structures of the porphyrin monomer and dimer, P1 and P2, the THS porphyrin side groups, and the 5CB liquid crystal molecules. The orientations of the zero-field splitting tensor axes (X, Y, Z) within the molecular frames of P1 and P2 as determined previously in reference [Citation30] are also indicated.
![Figure 1. Chemical structures of the porphyrin monomer and dimer, P1 and P2, the THS porphyrin side groups, and the 5CB liquid crystal molecules. The orientations of the zero-field splitting tensor axes (X, Y, Z) within the molecular frames of P1 and P2 as determined previously in reference [Citation30] are also indicated.](/cms/asset/2ade5bc3-85a9-4b0b-b082-effb54aaffd0/tmph_a_1511868_f0001_b.gif)
Figure 2. Overview of the two different orientations of the liquid crystal director with respect to the external magnetic field as used in the EPR experiments (left) and graphical representation of the definition of the angles θ and ϕ (right).
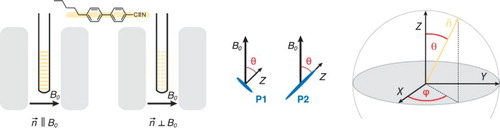
Figure 3. Comparison of the UV-vis spectra of P1 and P2 (M) recorded in toluene at room temperature with those taken in the isotropic phase of 5CB at 50
C.
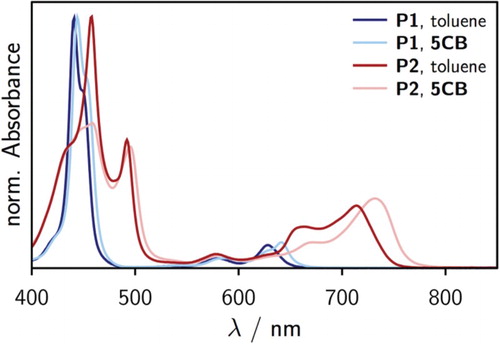
Figure 4. Comparison of the transient cw EPR spectra of P1 (left) and P2 (right) in unaligned and aligned 5CB at 90 K recorded after laser excitation (1 mJ, 20 Hz) at 640 nm and 730 nm for P1 and P2, respectively.
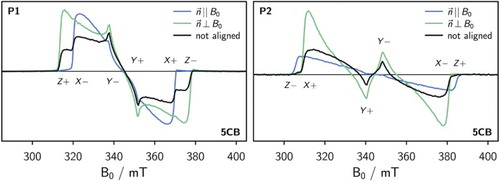
Figure 5. Experimental triplet cw EPR spectrum in unaligned 5CB together with the best fit assuming isotropic alignment for P1 (left) and P2 (right). The simulation parameters are indicated in the figure.
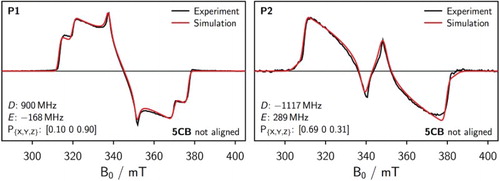
Figure 6. Simulated spectra assuming a biaxial distribution in comparison with the corresponding experimental spectra for P1 (left) and P2 (right). The parameters yielding the best fit to the experimental data are indicated in the figure.
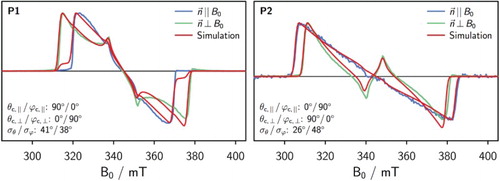
Table 1. Overview of the parameters used in the simulations of the spectra of the aligned samples of P1 and P2 in 5CB.
Supplementary Material.pdf
Download PDF (322.1 KB)Data availability statement
The data that support the findings of this study are available from the corresponding author, S.R., upon reasonable request.