Figures & data
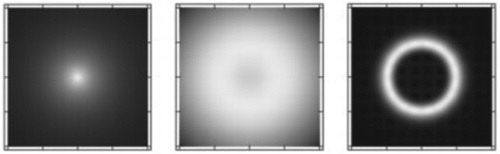
Figure 1. Example translationally invariant coordinates: coordinates of relative vectors within the many-particle system.
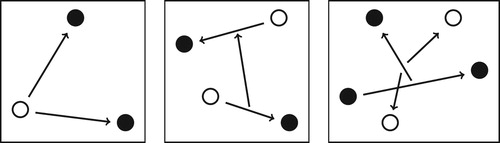
Figure 2. The ladder structure of the pre-Born–Oppenheimer (pre-BO) energy levels is visualised in the right. The left of the figure shows the rovibrational states corresponding to their respective potential energy surfaces in the Born–Oppenheimer (BO) approximation. While in the BO picture, the rovibrational states corresponding to the excited electronic state are bound states, the corresponding rovibronic states in pre-BO theory appear as resonances. [Reprinted with permission from E. Mátyus, J. Phys. Chem. A 117, 7195 (2013). Copyright 2013 American Chemical Society.]
![Figure 2. The ladder structure of the pre-Born–Oppenheimer (pre-BO) energy levels is visualised in the right. The left of the figure shows the rovibrational states corresponding to their respective potential energy surfaces in the Born–Oppenheimer (BO) approximation. While in the BO picture, the rovibrational states corresponding to the excited electronic state are bound states, the corresponding rovibronic states in pre-BO theory appear as resonances. [Reprinted with permission from E. Mátyus, J. Phys. Chem. A 117, 7195 (2013). Copyright 2013 American Chemical Society.]](/cms/asset/36c3f1cb-ce9c-4664-b7f1-b4e7ce4a0eb0/tmph_a_1530461_f0002_ob.jpg)
Figure 3. Part of the spectrum of the complex-scaled Hamiltonian, with
for the
block
and for the
block
with
and 2 total spatial angular momentum quantum numbers. The black triangles indicate the threshold energy of the dissociation continua corresponding to H(1)+H(1), H(1)+H(2), and H(1)+H(3). [Reprinted with permission from E. Mátyus, J. Phys. Chem. A 117, 7195 (2013). Copyright 2013 American Chemical Society.]
![Figure 3. Part of the spectrum of the complex-scaled Hamiltonian, H(θ) with θ∈[0.005,0.065] for the X 1Σg+ block [p=(−1)N,Sp=(1−p)/2,Se=0] and for the b 3Σu+ block [p=(−1)N,Sp=(1+p)/2,Se=1] with N=0,1, and 2 total spatial angular momentum quantum numbers. The black triangles indicate the threshold energy of the dissociation continua corresponding to H(1)+H(1), H(1)+H(2), and H(1)+H(3). [Reprinted with permission from E. Mátyus, J. Phys. Chem. A 117, 7195 (2013). Copyright 2013 American Chemical Society.]](/cms/asset/09a0f3b0-3e55-4b4c-a62d-d0bf42831c41/tmph_a_1530461_f0003_ob.jpg)
Figure 4. For the three-particle He atom and for the three-particle H molecular ion ‘we discuss the very same type of differential equation in an entirely different way’ [Citation97] in the standard quantum chemistry approach.
![Figure 4. For the three-particle He atom and for the three-particle H2+ molecular ion ‘we discuss the very same type of differential equation in an entirely different way’ [Citation97] in the standard quantum chemistry approach.](/cms/asset/9cfd7bd2-87c9-4f39-819a-e189e28a8602/tmph_a_1530461_f0004_oc.jpg)
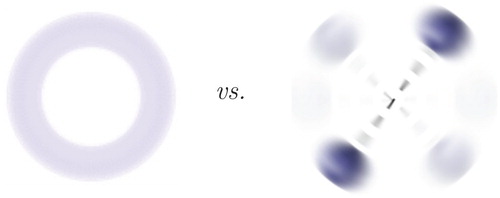
Figure 5. Transition of the ground-state particle density, , by increasing the
mass ratio in
-type systems [Citation72]. The centre (0) of each plot is the centre of mass.
![Figure 5. Transition of the ground-state particle density, D0a(1), by increasing the ma/mb mass ratio in {a±,a±,b∓}-type systems [Citation72]. The centre (0) of each plot is the centre of mass.](/cms/asset/1cf5f1c9-7d3d-4c5c-a24c-5e6587a2a584/tmph_a_1530461_f0005_ob.jpg)
Figure 6. Radial, , and angular,
, probability density functions computed for H
D
.
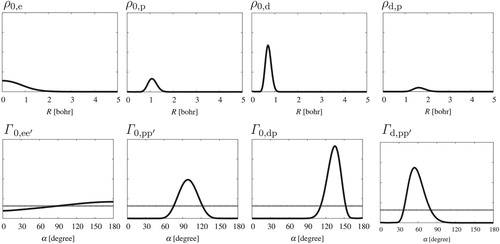
Figure 7. Quantum vs. classical structure of molecules: superposition or rotating dumbbell.