Figures & data
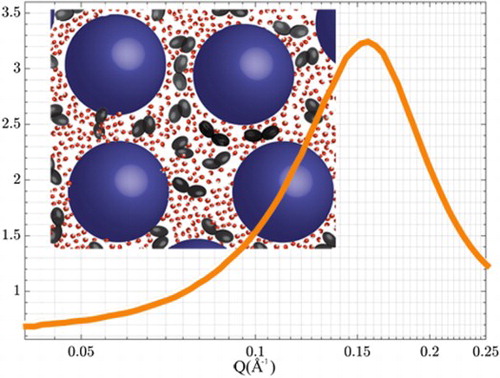
Figure 1. Scattering intensity of small-angle neutron scattering for all samples containing protein in D2O-solution. The inset shows a magnified view of the scattering from myoglobin in pure D2O.
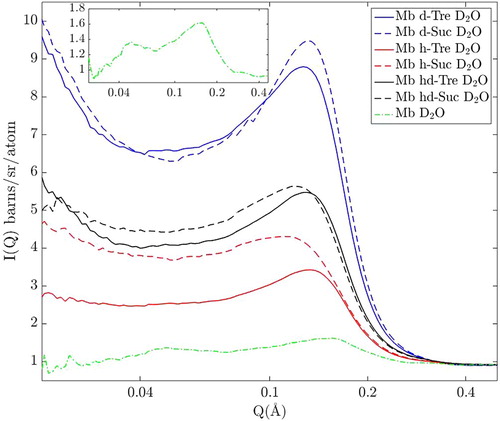
Table 1. Neutron scattering length densities of solvent and proteins in the different samples.
Figure 2. Normalized small angle X-ray scattering signal of 1wt% myoglobin in D2O (red dashed line) and simulated form factor based on pdb crystal structure (blue line).
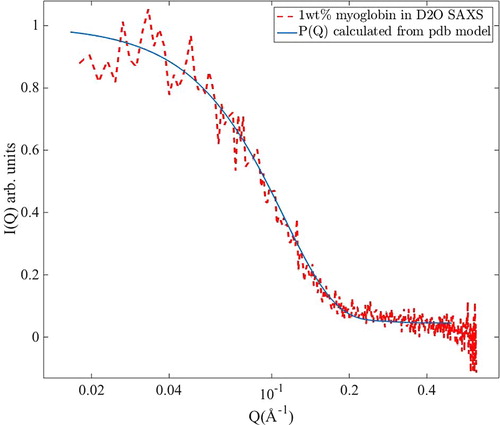
Figure 3. Small angle scattering of all samples with protein in D2O, after division by the form factor (i.e. with the structure factor remaining).

Figure 4. DSC scans of both investigated three-component systems, and the two-component system. Both sugars increase the denaturation temperature compared to myoglobin in water. Trehalose exhibits both higher glass transition temperature and denaturation temperature.
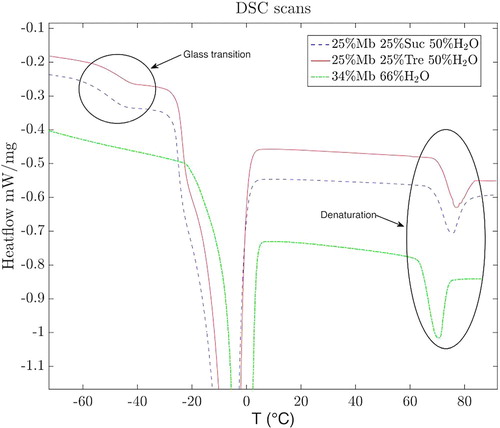
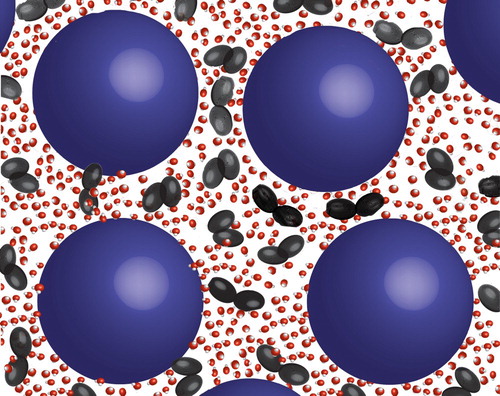
Figure 5. Sketch of proteins in aqueous sugar solutions. Blue spheres represent the protein, and the black double ellipsoids represent sugar molecules, whereas the water molecules are drawn in red and white.