Figures & data
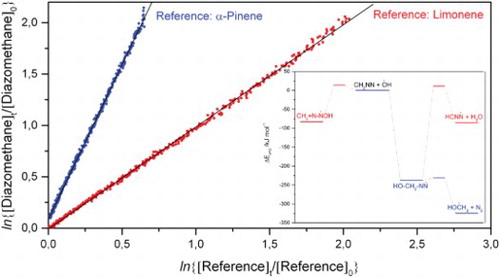
Figure 1. Normalised counts per second of the m/z 43.028 ion signal (CH3N2+) as a function of time during a CH2NN + O3 experiment. Full red curve: modelled CH2N2 decay. Dotted red curve: extrapolated model results. Inserted plot shows the O3 decay during the experiment.
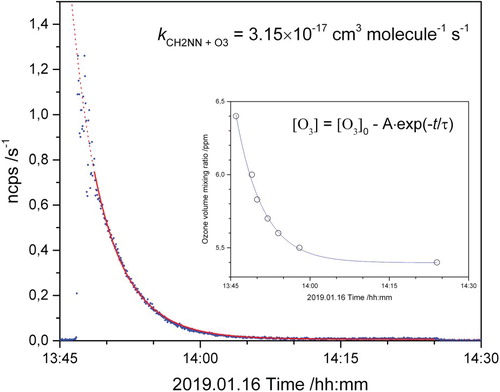
Figure 2. (A) Decays of diazomethane, limonene and α-pinene in the presence of OH radicals in 1 of the 2 experiments carried out. The data have been plotted as ln{[Diazomethane]0/[Diazomethane]t} vs. respectively ln{[Limonene]0/[Limone]t} or ln{[α-Pinene]0/[α-Pinene]t}. Analysis of the data points shown give relative rate coefficients kDiazomethane+OH/kLimonene+OH = 0.9941 ± 0.0017 and kDiazomethane+OH/kα-Pinene+OH = 3.012 ± 0.006 (1σ). The α-pinene data have been shifted for the sake of clarity.
![Figure 2. (A) Decays of diazomethane, limonene and α-pinene in the presence of OH radicals in 1 of the 2 experiments carried out. The data have been plotted as ln{[Diazomethane]0/[Diazomethane]t} vs. respectively ln{[Limonene]0/[Limone]t} or ln{[α-Pinene]0/[α-Pinene]t}. Analysis of the data points shown give relative rate coefficients kDiazomethane+OH/kLimonene+OH = 0.9941 ± 0.0017 and kDiazomethane+OH/kα-Pinene+OH = 3.012 ± 0.006 (1σ). The α-pinene data have been shifted for the sake of clarity.](/cms/asset/614dc4d1-87f7-4a57-9eef-d493fcabbc2d/tmph_a_1718227_f0002_oc.jpg)
Figure 3. Stationary points on the potential energy surface of the CH2NN + OH reaction. Results from CCSD(T*)-F12a/aug-cc-pVTZ//M06-2X/aug-cc-pVTZ calculations.
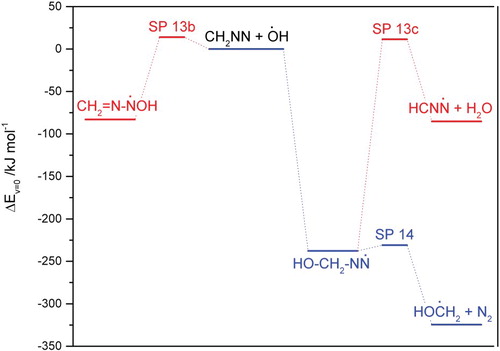
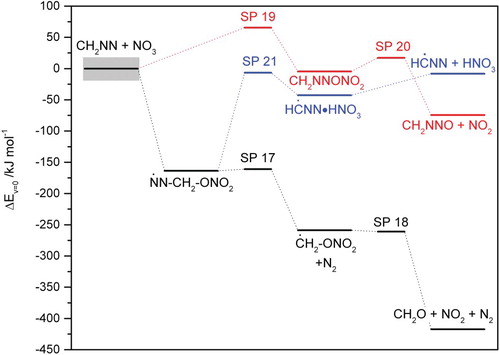
Figure 4. Stationary points on the potential energy surface of the CH2NN + NO3 reaction. Results from CCSD(T*)-F12a/aug-cc-pVTZ//M06-2X/aug-cc-pVTZ calculations. The grey box illustrates the inherent uncertainty in the electronic energy of the NO3 radical.