Figures & data
Figure 1. Schematic of the typical process required to compute properties of soft matter systems from system ‘chemistry’, which refers to chemical composition and state (including temperature, pressure and composition), starting from the need to either gather or derive force field parameters to model the system. For coarse-grained (CG) simulations, the CG force fields are often derived from atomistic simulations.
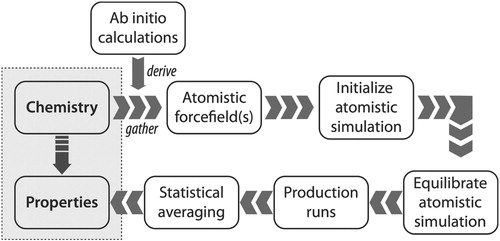
Figure 2. Python script that uses mBuild to define a class for a –CH– group, create a polymer composed of multiple –CH
– groups, and connects copies of this polymer to a surface. Note for simplicity, the terminal CH
group is not shown.
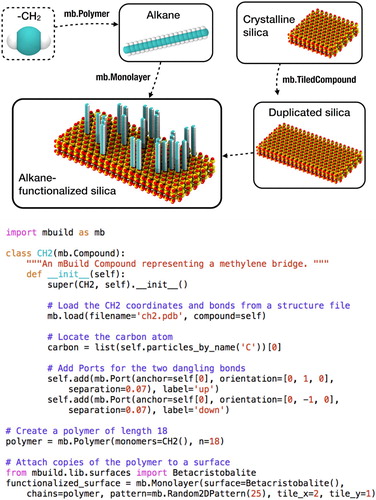
Figure 3. Two boxes of ethane constructed in mBuild. Liquid phase (left) and vapour phase (right) are simulated simultaneously in GEMC.
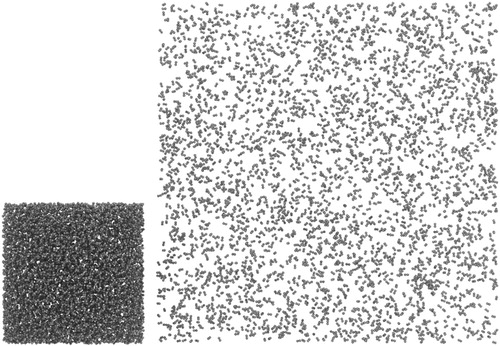
Figure 4. Vapor pressure (left), vapour density (middle), and liquid density (right) plots for ethane at 236 K, using GEMC in GOMC with the TraPPE force field.
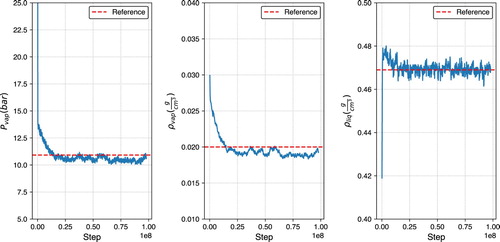
Figure 5. A snapshot of the graphene slit pore system containing graphene carbon (cyan), water (red for oxygen and white for hydrogen), sodium ions (blue) and chlorine ions (green).
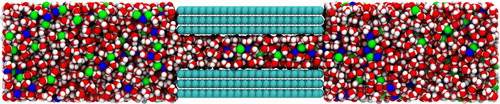
Figure 6. Number density profiles across the width of the pore for water, Na, and Cl.
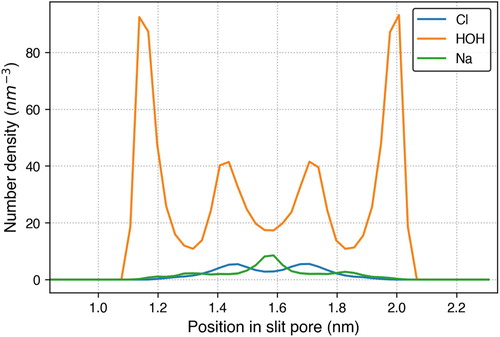
Figure 7. Simulation snapshot of lipid bilayer containing CER N-hydroxysphingosine C24:0 (CER NS), cholesterol and lignoceric acid. The CER NS and FFA tails are shown in silver, cholesterol in yellow, and the headgroup oxygen, nitrogen and hydrogen atoms in red, blue and white respectively.
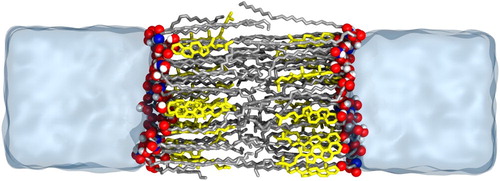
Figure 8. Simulated NSLD profiles for specifically deuterated lipid tails.
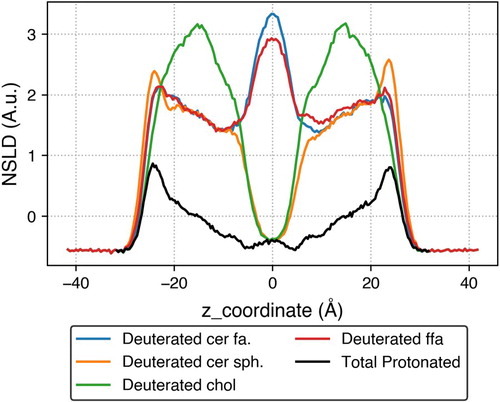
Figure 9. Thin film coated surfaces model.
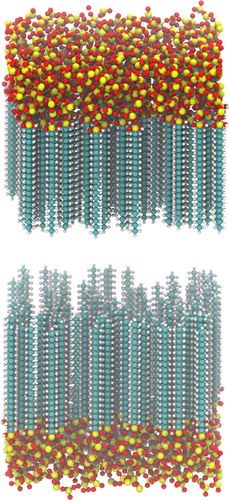
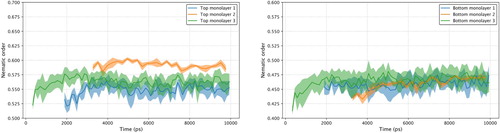
Figure 10. Steady state nematic order of the thin film coated on top and bottom surfaces.