Figures & data
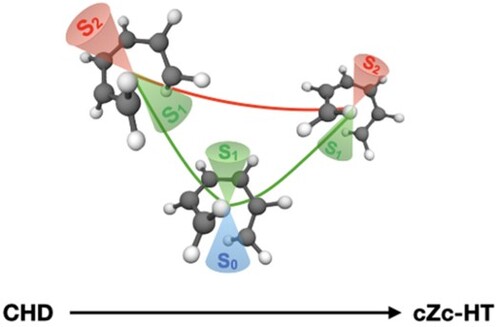
Figure 1. Schematic representation of the CHD to cZc-HT photochemical interconversion. The dashed lines represent the crossing between excited states S(2
A) and S
(1
B), and S
(2
A) and the ground state S
(1
A). FC refers to the Franck-Condon region.
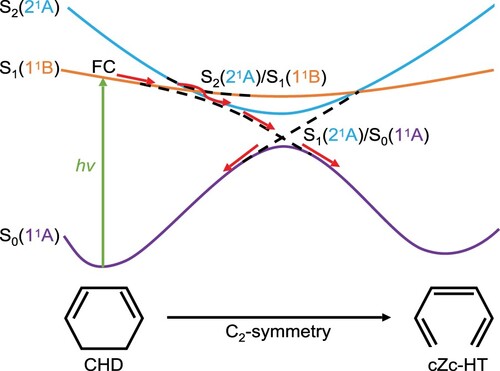
Figure 2. Orbital correlation diagram for the photochemical interconversion of the CHD to cZc-HT. The orbitals of CHD and cZc-HT are ordered in energy and labelled as symmetric (S) and antisymmetric (A) under C symmetry. Dashed lines relate empty orbitals with the same symmetry and solid lines relate occupied orbitals with the same symmetry.
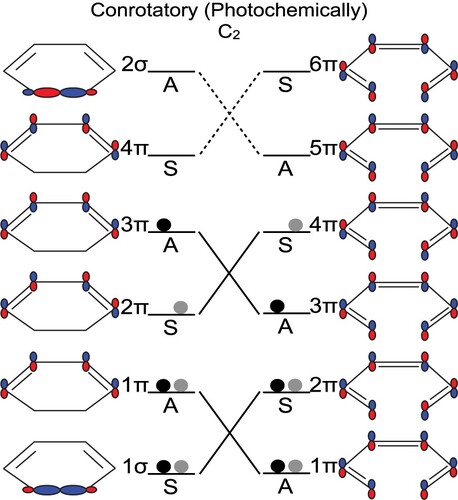
Figure 3. Scheme of the state correlation diagram for the photocyclisation of CHD to cZc-HT. Dashed lines connect molecular orbitals with the same symmetry and same multiplicity, and solid blue lines connect molecular orbitals satisfying the non-crossing rule.
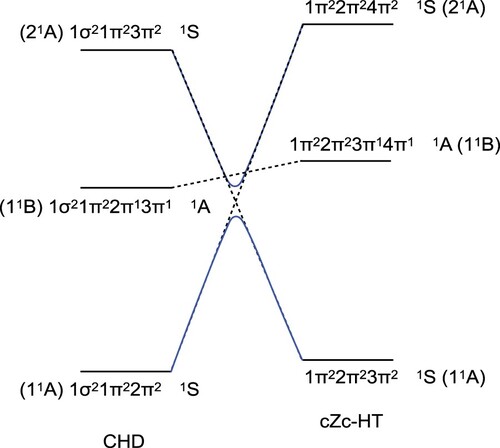
Figure 4. Schematic representation of a CI between two PESs in the -2-dimensional space. Two orthogonal vectors define the 2-dimesional branching space: g which points in the direction of maximal energy splitting and h which points in the direction of maximal nonadiabatic interaction.
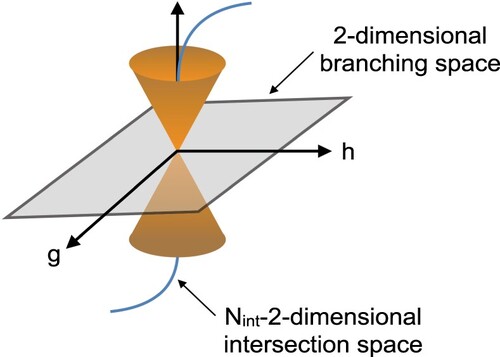
Figure 5. Optimised geometries with DFT(ωB97X-D)/cc-pVDZ: (a) ground state CHD, (b) ground state cZc-HT. Optimised geometries with SF-TDDFT(BHHLYP)/cc-pVDZ: (c) CI (from CHD), (d) CI
, (e) CI
(from cZc-HT), (f) S
, (g) S
and (h) S
transition state. Distances are in Å.
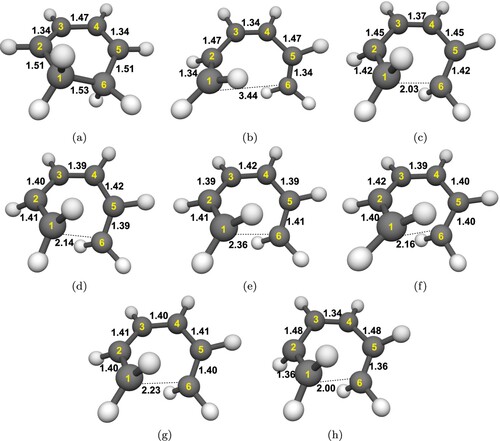
Table 1. Vertical excitation energies in eV for the two lowest singlet excited states of CHD and cZc-HT.
Figure 6. (a) CI: potential energies curves (i), norm of derivative coupling (ii) and distance between the reaction carbons C
–C
(iii) along the S
/S
MECP optimisation trajectory of the CHD. (b) CI
: potential energies curves (i), norm of derivative coupling (ii) and distance between the reaction carbons C
–C
(iii) along the S
/S
MECP optimisation trajectory of the CHD. The energies are relatives to the S
energy of the CHD.
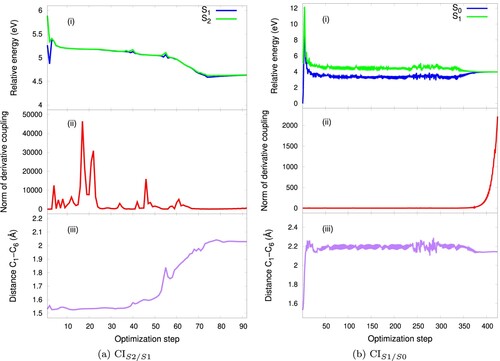
Figure 7. (a) CI: potential energies curves (i), norm of derivative coupling (ii) and distance between the reaction carbons C
–C
(iii) along the S
/S
MECP optimisation trajectory of the cZc-HT. (b) CI
: potential energies curves (i), norm of derivative coupling (ii) and distance between the reaction carbons C
–C
(iii) along the S
/S
MECP optimisation trajectory of the cZc-HT. The energies are relatives to the S
energy of the CHD.
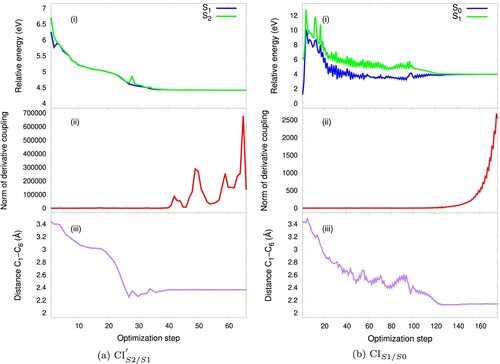
Table 2. C –C bond distances and energies at different level of theories. The distances are in Å and after the slash, the energies relative to S energy of CHD are in eV.
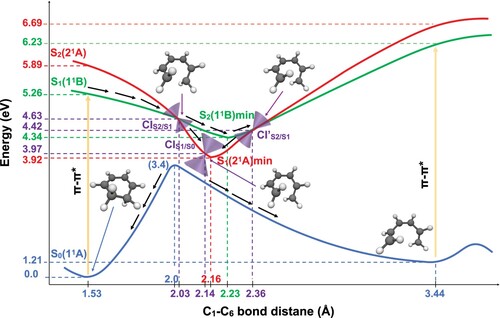
Figure 8. Schematic representation of the PESs of CHD/cZc-HT photochemical interconversion. The reaction coordinate is the C–C
bond distance. The 1
A (ground state) is in blue, the state 1
B is in green and the state 2
A is in red. The curves 1
B and 2
A are a pictorial description that connects the important geometries computed with SF-BHHLYP/cc-pVDZ. The curve 1
A is a PES scan trough the C
–C
bond distance computed with SF-BHHLYP/cc-pVDZ. The cones in purple represent the MEPCs. The arrows depict how the photochemical interconversion process follow after an absorption of a photon generates the population of the first excited state (1
B) of CHD.