Figures & data
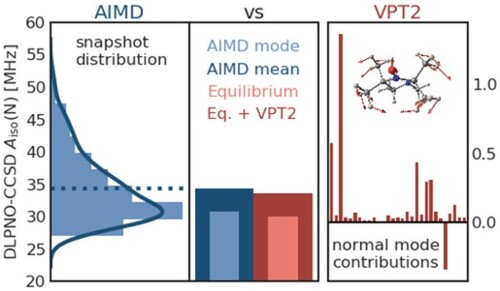
Figure 1. Lewis structure and ball-and-stick representation of 2,2,3,4,5,5-hexamethylperhydroimidazol-1-oxyl (HMI) with the spin density (DLPNO-CCSD/def2-TZVPP-decS level of theory, iso-value=0.01) of the radical included in wireframe representation.
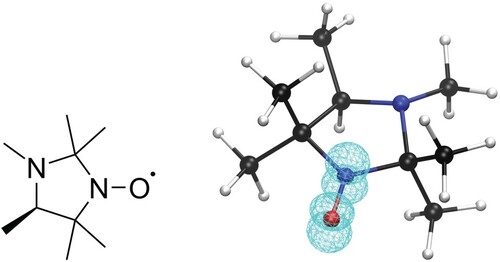
Table 1. Dependence of the HFCCs of the nitroxy-N on the chosen basis set and decontraction scheme (decAll = decontraction of the whole basis set, decS = decontraction of the s-functions).
Table 2. Dependence of the HFCCs on the level of theory.
Table 3. Dependence of the HFCCs, calculated at different levels of theory, on the method used for geometry optimisation.
Table 4. Vibrational corrections to the HFCCs of HMI, calculated using VPT2 and different methods for the FF and HFCCs.
Figure 2. Contributions of each normal mode to the VPT2 ZPVCs of the nitrogen (top) and oxygen (bottom) HFCCs. A step size of 0.05 and 0.2 was used at the revPBE0 and DLPNO-CCSD levels, respectively. In both cases, the revPBE-D3(0) FF was used.
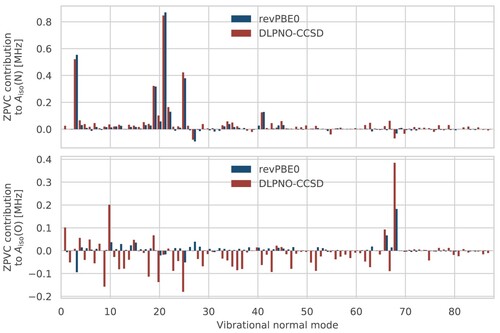
Table 5. Comparison of ZPVC contributions from a single vibrational mode, calculated using different methods for the HFCCs, and different displacement step sizes.
Figure 3. Change of the nitrogen (left) and oxygen (right) HFCC upon displacement along normal mode 68 (see text for details). Calculations performed with DLPNO-CCSD/def2-TZVPP-decS and DLPNO-HFC2 thresholds (denoted simply ‘DLPNO’), same with tighter (‘DLPNO(+DO)’) or with tighter
(‘DLPNO(+PNO)’), and canonical CCSD/cc-pCVDZ-decS (‘CCSD’).
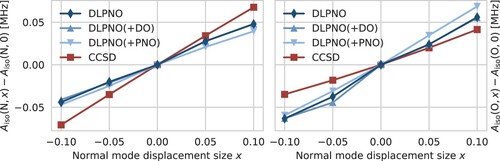
Figure 4. Convergence of the thermal averages of the isotropic HFCCs for the relevant nitrogen (left) and oxygen (right) atoms in HMI computed from single-point revPBE0 (top) and DLPNO-CCSD (bottom) property calculations shown as a function of the number of underlying configuration snapshots used to compute these averages. The snapshots have been extracted from the revPBE0-D3(0) AIMD simulation of HMI in vacuum in the canonical ensemble at 300 K, see text. The average values are shown as dots while the standard deviations given the respective sample size are shown as vertical lines. The red horizontal lines denote the final average using all 255 snapshots.
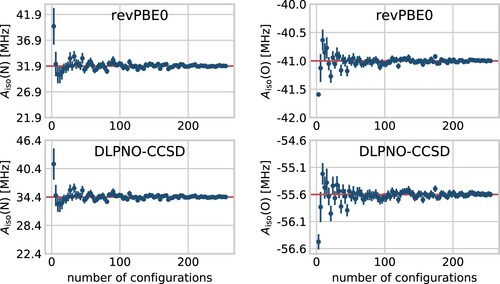
Figure 5. Histograms of the isotropic HFCCs for the relevant nitrogen (left) and oxygen (right) atoms in HMI computed from single-point revPBE0 (top) and DLPNO-CCSD (bottom) property calculations based on all configuration snapshots sampled from the revPBE0-D3(0) AIMD simulation of HMI in vacuum in the canonical ensemble at 300 K. The solid line displays the kernel density estimation curves which were used to determine the most probable values from the respective modes (upper value close to the maximum of each subplot), whereas the vertical dashed lines are the corresponding averages neither obtained from the histograms nor kernel densities approximations but on the full sample (lower value of each subplot), thus being identical to the red horizontal lines in Figure .
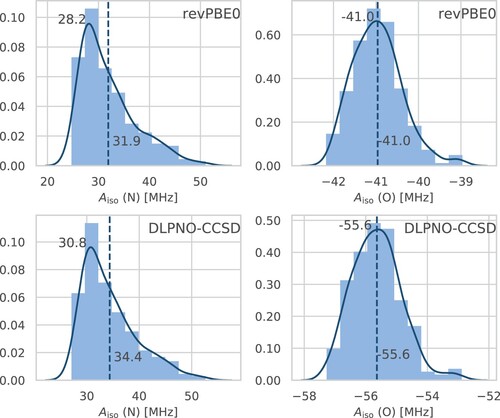
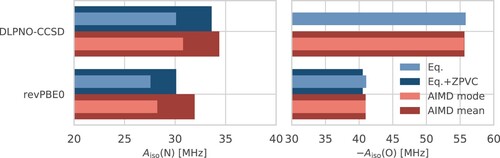
Figure 6. Isotropic HFCCs, , for the nitrogen (left) and oxygen (right) atoms of HMI in vacuum according to DLPNO-CCSD (top) and revPBE0 (bottom) electronic structure computed from VPT2 at the revPBE0-D3(0) equilibrium geometry of HMI without (‘Eq.’: light blue) and with (‘Eq + ZPVC’: dark blue) ZPVCs and those obtained from DLPNO-CCSD (top) and revPBE0 (bottom) single-point property calculations based on the configuration snapshots sampled from the revPBE0-D3(0) AIMD simulation of HMI in vacuum in the canonical ensemble at 300 K where the most probable value (‘AIMD mode’: light red) and the thermal average (‘AIMD mean’: dark red), thus including the TFCs at 300 K, are depicted, see text for background. Note that the ‘Eq + ZPVC’ value for the oxygen atom from DLPNO-CCSD VPT2 calculations is not reported for reasons explained in the text.