Figures & data

Figure 1. (a–e) Five lowest energy-minimized structures of the acenaphthene dimer and (f–h) three lowest energy-minimized structures of the naphthalene dimer. The corresponding interaction energies are given below the structures.
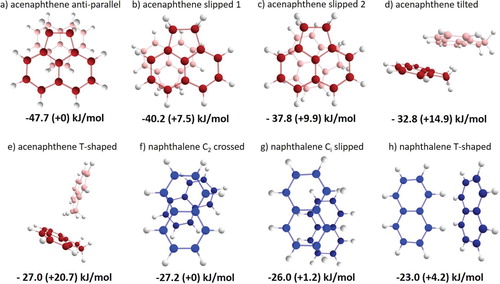
Figure 2. High-resolution experimental IR spectra of the acenaphthene monomer and dimer (black) in the 3 µm region in combination with calculated IR spectra (red) at the B3LYP-D3/Jun-cc-pVDZ level using a scaling factor for the harmonic frequencies of 0.96.
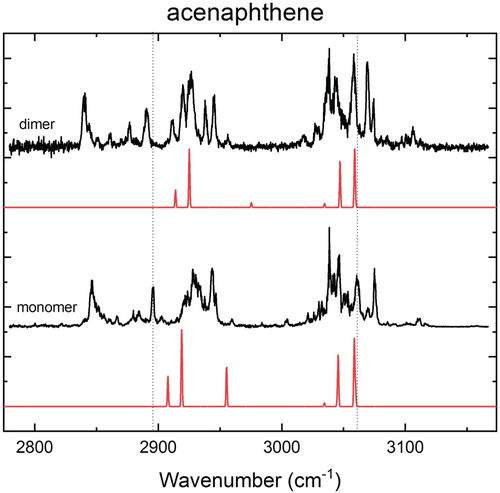
Figure 3. High-resolution IR spectra of the naphthalene monomer (obtained by Maltseva et al. [Citation47]) and dimer (black) in combination with predicted spectra of the configurations presented in Figure (T-shaped (purple), C2 crossed parallel (dark blue) and Ci slipped parallel (light blue)) at the B3LYP-D3/Jun-cc-pVDZ level of theory using the harmonic approximation and a frequency scaling factor of 0.96.
![Figure 3. High-resolution IR spectra of the naphthalene monomer (obtained by Maltseva et al. [Citation47]) and dimer (black) in combination with predicted spectra of the configurations presented in Figure 1 (T-shaped (purple), C2 crossed parallel (dark blue) and Ci slipped parallel (light blue)) at the B3LYP-D3/Jun-cc-pVDZ level of theory using the harmonic approximation and a frequency scaling factor of 0.96.](/cms/asset/3583d2ab-4ded-401e-b3d0-63a667f8f89e/tmph_a_1811908_f0003_oc.jpg)
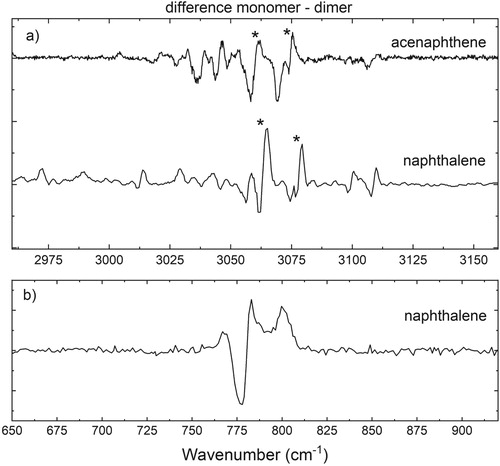
Figure 4. (a) Difference spectra (monomer-dimer) of acenaphthene and naphthalene in the aromatic CH stretch region and (b) of naphthalene in the aromatic CH out-of-plane region. In the monomer-dimer difference plot, a redshift manifests itself as a negative going to positive signal from low to high wavenumbers. The CH stretch and the CH out-of-plane region show a redshift of 2–3 and 4 cm−1, respectively, as a result of complex formation.