Figures & data
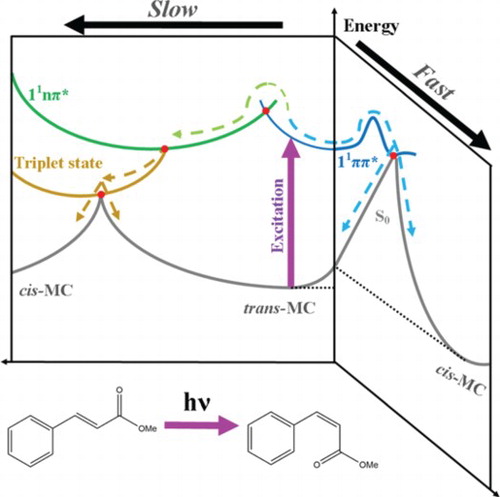
Figure 1. Experimentally observed (red) and theoretically predicted (blue, green) spectrum of trans-MC in cyclohexane. Both the highest observed experimental absorption and highest predicted oscillator strength were normalised to 1. Blue lines denote two excitations with ππ* character and the green line denotes a darker excitation with nπ* character. The orbitals that are primarily involved in the lowest energy ππ* and nπ* transitions are displayed inset.
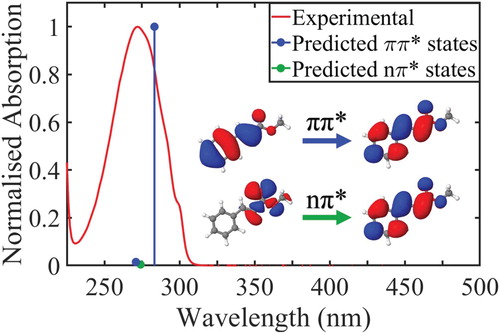
Figure 2. top: TR-IY and TR-PES transients for trans-MC photoexcited at 294 nm (around the 11ππ* origin), and probed with 200 nm. The polarisations of the pump and probe beams were parallel with respect to each other in both TR-IY and TR-PES experiments so that the results were comparable. bottom: TKER spectra obtained following photoexcitation of trans-MC at 294 nm and at a pump–probe delay of Δt = −5, 0 and 10 ps. Inset: PES-VMI at Δt = 0. Black arrow shows the value for TKERmax.
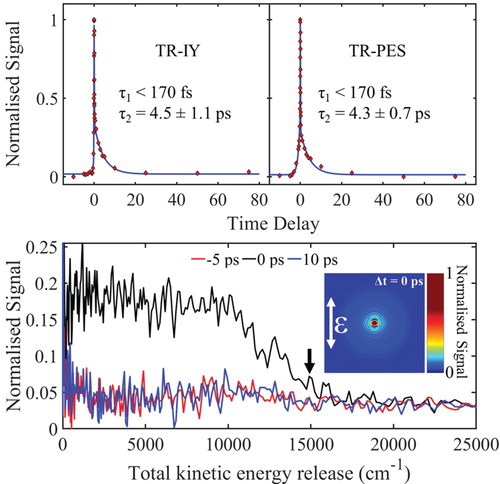
Figure 3. top: Steady-state UV-Vis absorption spectra corresponding to the non-irradiated (red curve) and after 30 min of constant irradiation (blue curve) of trans-MC at 280 nm. bottom: 1H NMR spectra of trans-MC in deuterated cyclohexane before (blue curve) and after 30 min (red curve) of irradiation at 280 nm.
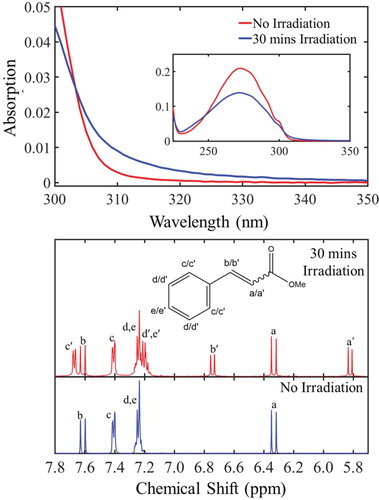
Figure 4. top: False colour map showing TAS of trans-MC in cyclohexane with λpump = 280 nm bottom: (a) Decay associated spectra (DAS) extracted from global fit. The DAS amplitude corresponding to τ3 (DAS3) is multiplied by 5 to achieve a better illustration. (b) TAS at selected pump-probe time delays. These plots correspond to vertical slices through the false colour heat map at the selected time delays.
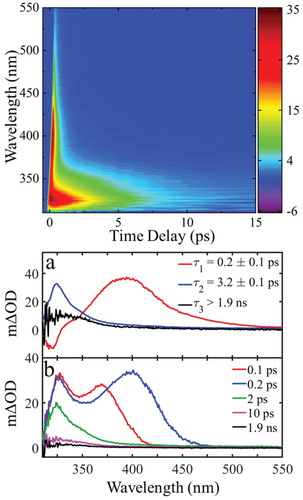
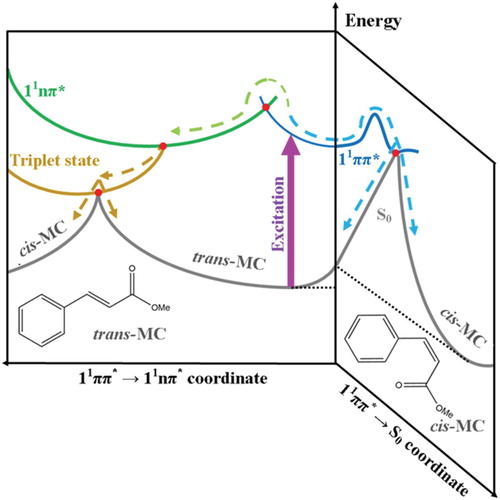
Figure 5. Qualitive illustration of the potential energy surfaces showing the proposed non-radiative relaxation mechanisms of trans-MC with respect to two trans-cis isomerisation reaction coordinates. This figure is adapted from ref. 29.