Figures & data
Figure 1. The orbital sub-spacing for a spin-restricted case. The horizontal lines represent spatial orbitals, divided into frozen-core, dynamical core, and active. The active orbital space is further split into the hole and particle subspaces those occupied and virtual with respect to the Hartree-Fock determinant. The up and down arrows represent electrons.
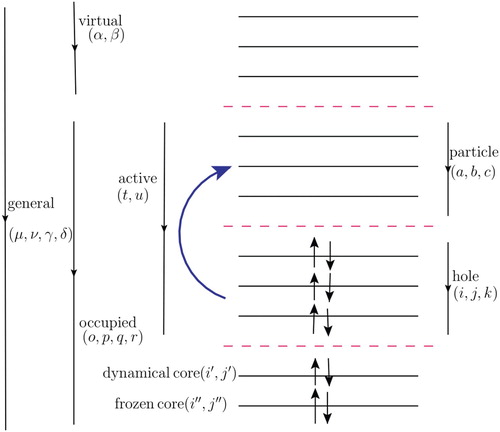
Figure 2. HHG spectra of Ne exposed to a laser pulse with a wavelength of 800 nm and an intensity of . Results of the TD-OMP2 method with different numbers of orbital configuration (m, n, o) and maximum angular momentum
.
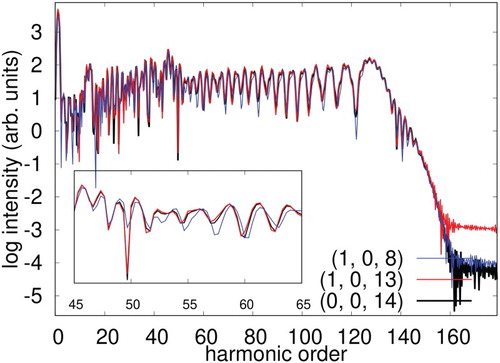
Figure 3. HHG spectra of Ne exposed to a laser pulse with a wavelength of 800 nm and an intensity of . Results of the TD-OMP2 method obtained with different maximum angular momentum
with the orbital configuration
.
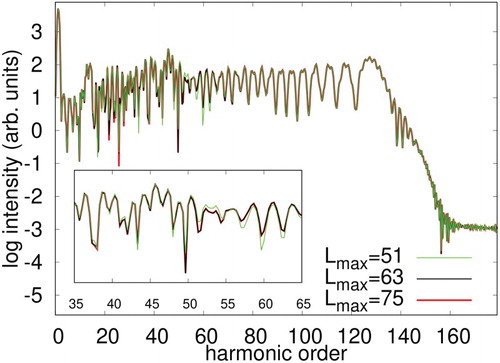
Figure 4. HHG spectra of Ne exposed to a laser pulse having a wavelength of 800 nm and varying intensities of ,
, and
, obtained with the TD-OMP2 method with an orbital configuration
and maximum angular momentum
.
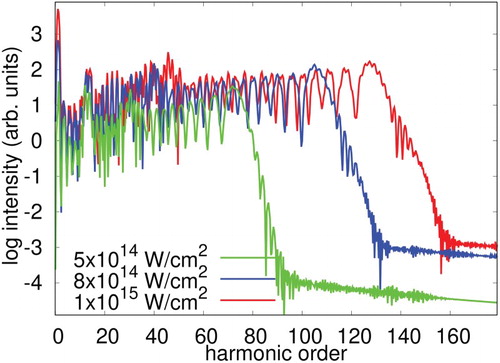
Figure 5. HHG spectra of Ne exposed to laser pulse with a wavelength of 800 nm and an intensity , Comparison of TD-OMP2 method with TD-CASSCF, and TDHF methods. Maximum angular momentum
and
active space configuration for the correlation methods has been used.
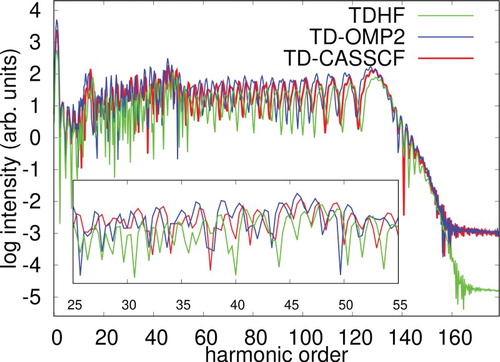
Figure 6. HHG spectra of Ne exposed to a laser pulse with a wavelength of 1200 nm and an intensity of . Results of the TDHF method obtained with different maximum angular momentum
.
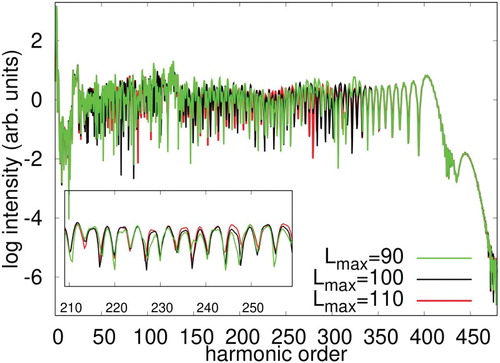
Figure 7. HHG spectra of Ne exposed to laser pulse with a wavelength of 1200 nm and varying intensities of ,
, and
, obtained with TD-OMP2 method with the orbital configuration
and the maximum angular momentum
.
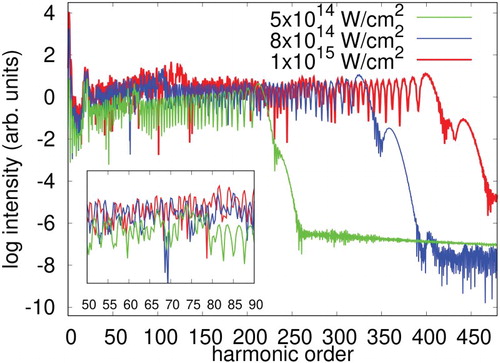
Figure 8. HHG spectra of Ne exposed to laser pulse with a wavelength of 1200 nm having intensity of , Comparison of TD-OMP2 method with TD-CASSCF, and TDHF method. Maximum angular momentum
and
active space configuration for the correlation methods has been used.
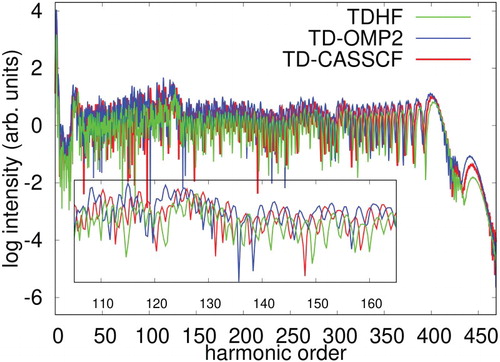
Figure 9. Time evolution of the dipole moment of Ne irradiated by a laser pulse of a wavelength of (a) 800 nm, (b) 1200 nm at an intensity of , calculated with TDHF, TD-OMP2 and TD-CASSCF methods.
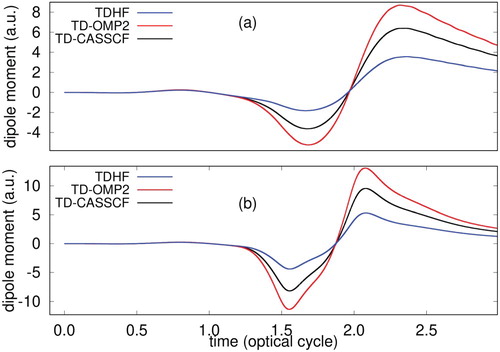
Figure 10. Time evolution of single ionisation probability of Ne irradiated by a laser pulse of a wavelength of (a) 800 nm, (b) 1200 nm at an intensity of , calculated with TDHF, TD-OMP2 and TD-CASSCF methods.
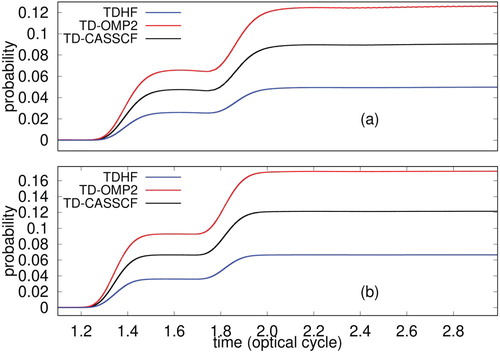
Figure 11. Time evolution of the dipole moment of Ne irradiated by a laser pulse of a wavelength of 800 nm at an intensity of , calculated with TDHF, TD-OMP2, TD-CC2 and TD-CASSCF methods.
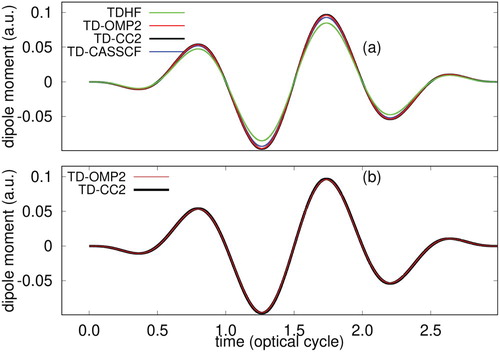
Figure 12. HHG spectra of Ne irradiated by a laser pulse of a wavelength of 800 nm at an intensity of , calculated with TDHF, TD-OMP2, TD-CC2 and TD-CASSCF methods.
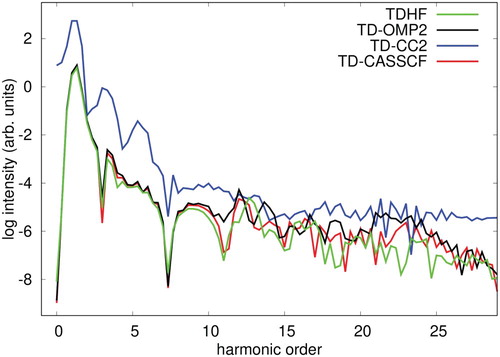
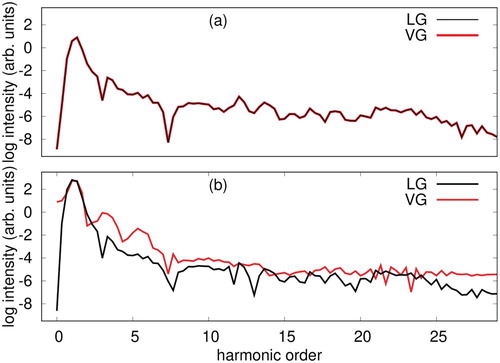
Figure 13. HHG spectra of Ne in the length gauge (LG) and velocity gauge (VG) irradiated by a laser pulse of a wavelength of 800 nm at an intensity of , calculated with (a) TD-OMP2, and (b) TD-CC2 method.