
Figures & data
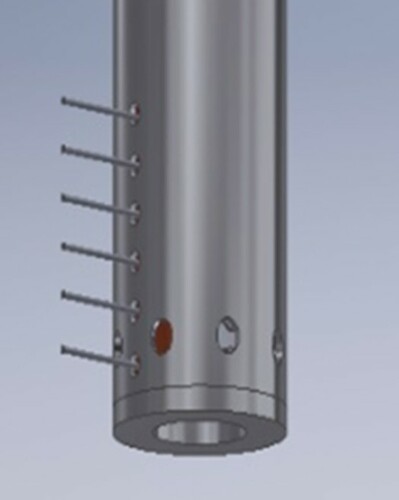
Figure 1. (a) Compact tubular VMI lens showing the 22 mm diameter 11 cm long metal shield with high voltage connections. (b) Cross section of the compact lens design, sliced at a plane including the electrical feed-through.
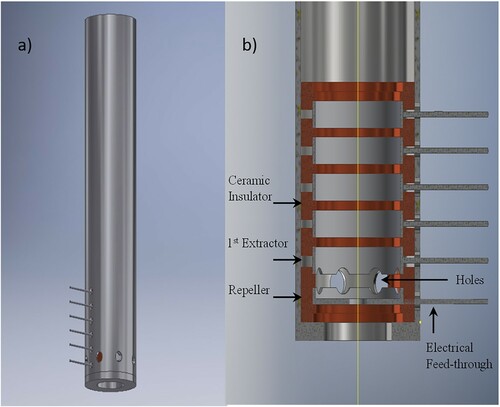
Figure 2. Comparison of raw (log intensity scale) VMI images for O+ formation via 3dπ 3Σ (v=2) Rydberg state at 224.995 nm in vacuum. Left: Raw O+ image with the conventional lens. Right: Raw O+ image using the compact lens. Image intensity is represented by colour bar and the electric field of the linearly polarised REMPI laser is parallel to the detector face, in the direction indicated by the double headed arrow.
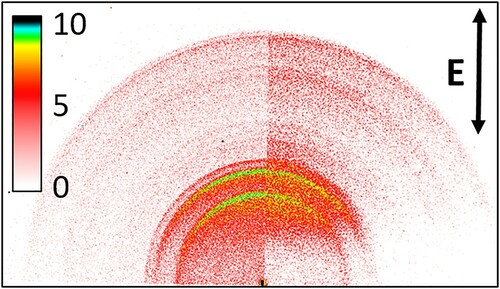
Figure 3. Total kinetic energy release distributions for O+ formation at 225 nm with an offset for clarity. The black and the red curve corresponds to compact and conventional lens, respectively.
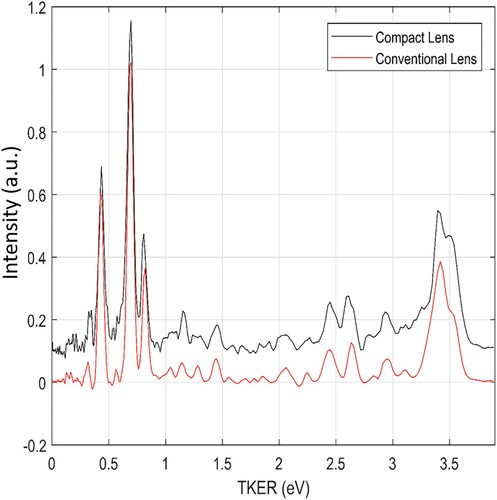
Figure 4. Angular distribution of the 0.68 eV TKER peak in using (a) the compact tubular VMI lens, and (b) a conventional VMI lens.
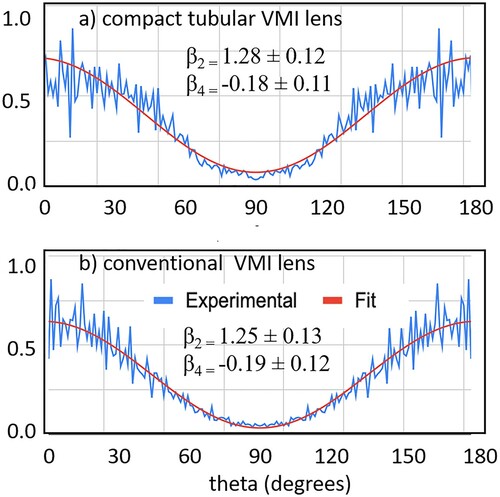
Figure 5. Raw NO-Ar scattering images at ∼ 530 cm-1 collision energy using (a) the tubular VMI lens. In panel (b) images reported by Eyles et al. [Citation24] using a conventional annular ring VMI lens and roughly similar experimental conditions are shown for comparison. The Figure was adopted from Ref [Citation24] with the permission of The Royal Society of Chemistry.
![Figure 5. Raw NO-Ar scattering images at ∼ 530 cm-1 collision energy using (a) the tubular VMI lens. In panel (b) images reported by Eyles et al. [Citation24] using a conventional annular ring VMI lens and roughly similar experimental conditions are shown for comparison. The Figure was adopted from Ref [Citation24] with the permission of The Royal Society of Chemistry.](/cms/asset/3a22659f-0a4c-40c2-9556-88d3d37936be/tmph_a_1910357_f0005_oc.jpg)