Figures & data
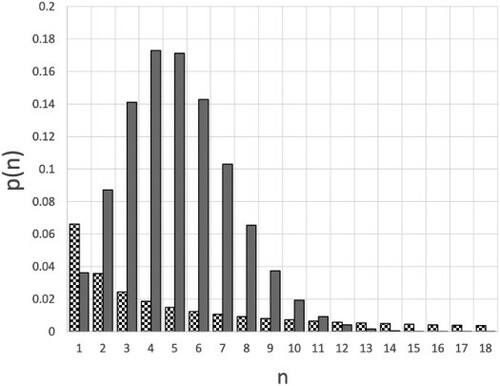
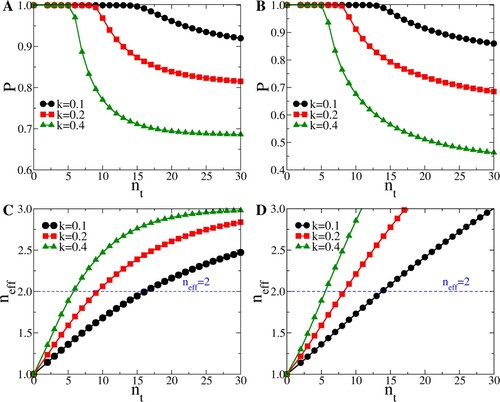
Figure 1. Comparison of the probability distribution for a value of R = 5, which is in the range of the COVID19 variants that appeared in late 2020 [Citation8]. The grey bars correspond to a Poisson distribution; the chequered bars correspond to a negative binomial with k = 0.1. To improve the readability of the figure, the data points for n = 0 have not been included. For the Poisson case,
, whereas for the case with k = 0.1,
, which means that 67% of all infectious persons infect nobody else.
![Figure 1. Comparison of the probability distribution p(n,1) for a value of R = 5, which is in the range of the COVID19 variants that appeared in late 2020 [Citation8]. The grey bars correspond to a Poisson distribution; the chequered bars correspond to a negative binomial with k = 0.1. To improve the readability of the figure, the data points for n = 0 have not been included. For the Poisson case, p(0)≈0.0067, whereas for the case with k = 0.1, p(0,1)≈0.67, which means that 67% of all infectious persons infect nobody else.](/cms/asset/94bbf79e-d6af-4499-b312-a8e2db694034/tmph_a_1936247_f0001_ob.jpg)
Figure 2. Extinction probability P of an infection chain started by one infected individual, as a function of R and k. The negative binomial distribution (Equation (Equation1(1)
(1) )) is not truncated.
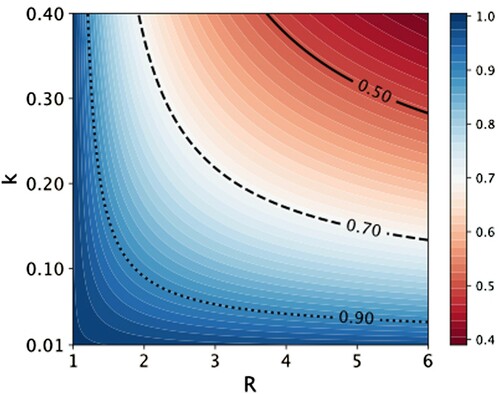
Figure 3. As an illustration of the effect of limiting the number of contacts of an individual to , the curves in this figure show how the threshold for an outbreak (
) depends on the bare reproduction number R and the dispersion factor k. For a given value of k, the area to the left of the curve corresponds to the parameter range where no outbreaks occur. In reality, this boundary will not be sharp. Clearly, the effect of limiting the number of contacts is largest for highly over-dispersed distributions (small k). We do not show the result for the Poisson distribution, because in that case truncating
has no effect in the range of
shown, unless R is very close to one.
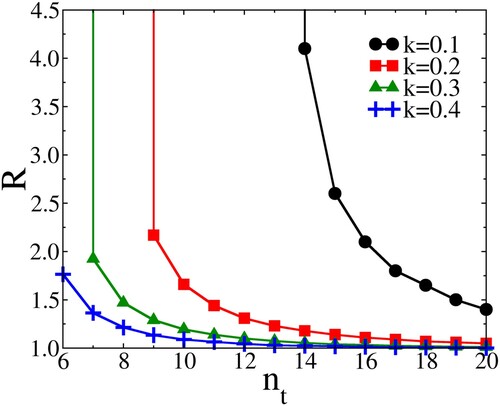
Figure 4. (A) Extinction probability P versus (see text) for
, and
, 0.2, 0.4. (B) Extinction probability P versus
for
, and
, 0.2, 0.4. (C) Average number infected versus
in a transient outbreak, for
, and k = 0.1, 0.2, 0.4. (D) Average number infected versus
in a transient outbreak, for
, and k = 0.1, 0.2, 0.4.