Figures & data
Figure 1. Layer-dependent morphologies of ultrathin water wetting film in graphene-mica, WS2-mica, and MoS2-mica interfaces: SFM height images of (a) graphene-mica interface, (b) WS2-mica interface, (c and d) MoS2-mica interface. In (b), WS2 single and double layers are partially wetted. (c) shows early stage of wetting under double layer MoS2 and D shows later wetting stage in the same area of MoS2. Number of 2D material layers are shown in roman numerals. In (a), under 1–3 layers thick graphenes the water film exhibits a labyrinthine morphology. Image (b) shows WS2 single layer with structured and double layer with compact wetting film. Image (c) shows earlier stage of wetting where region II of MoS2-mica interface is partially wetted with water. D shows region II of MoS2 now fully wetted, and region I is partially wetted. In both WS2 and MoS2 only under single layers the wetting film is laterally structured. Under the two layers of WS2 and MoS2 a compact wetting film of water is observed. Bare mica in all images is replaced with a grey color (see Supporting Information for details). Images without the grey masks are shown in supporting information Figure S1.
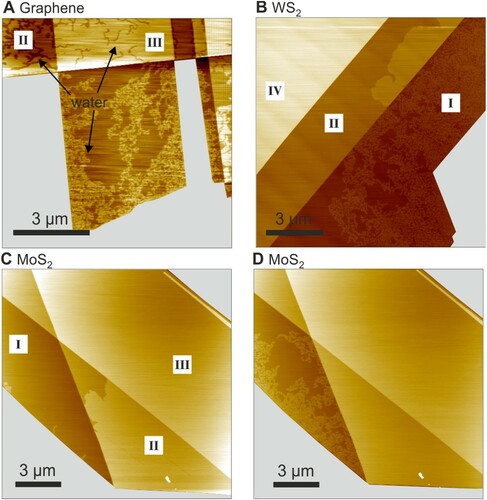
Figure 2. Graphene layer thickness dependent widths of structure. (a–d) height images of water wetting mica-graphene interfaces with graphene thicknesses ranging from 1 to 4 graphene layers. Black lines in (a) mark typical cross-sectional profiles used for measuring structure widths. (e) Structure width increases with graphene layer thickness; the squares show the data for water wetting graphene mica interfaces. The circle shows the band width for water wetting monolayer MoS2. The error bars show the standard deviations. The solidline is the fit of the experimental data for graphene with an exponential function .
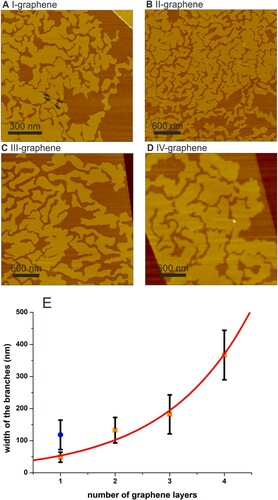
Figure 3. Ethanol wetting kinetics: Relative vapour pressure of ethanol is shown top left of each image. Time in minutes is shown top-right. Roman numerals indicate the number of layers of the 2D materials. Top row (left to right): single-layer MoS2 on mica. Bottom row (left to right): single-layer graphene on mica. The MoS2 interface did not show any changes at
for 30 min. The graphene interface did not show any changes at
for 20 min. As
is increased to 14% a compact layer starts wetting the two interfaces from edges eventually forming a complete monolayer. Phase images (insets) show no change in contrast, suggesting the wetting film is under the 2D covers. In the bottom row sequence, wetting was halted by purging with dry nitrogen and subsequently resumed by increasing
again. Right-most image of graphene was acquired after wetting resumed. Completely wetted interfaces recover the ultra-flat topography. Bare mica areas are masked grey; images without the grey masks are shown in supporting information Figure S2.
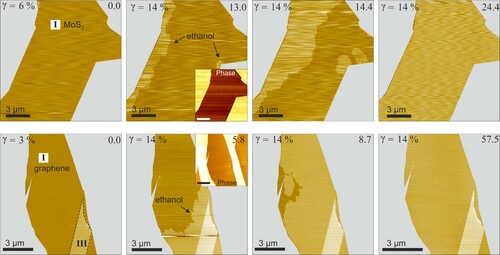
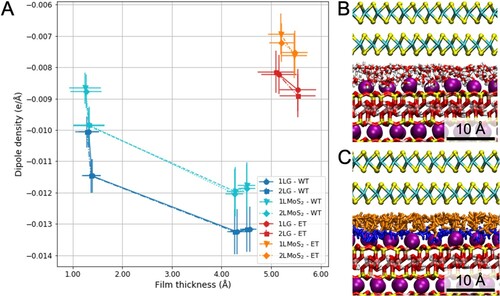
Figure 4. Dipole density for different molecular fillings of interfaces between mica and 2D materials, 1L and 2L of graphene and MoS2, as a function of film thickness (a). MD snapshots after 50 ns of MD simulations of the 2L MoS2-mica interface filled with water (b) and a mixture of ethanol and water molecules (c).