
Figures & data
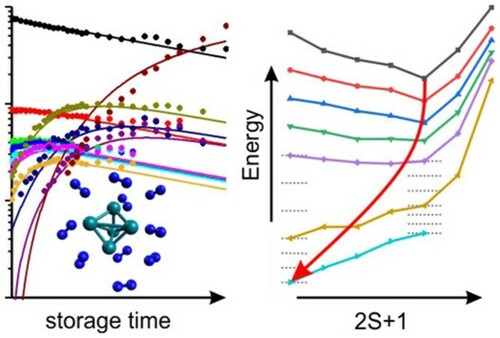
Figure 1. Temporal evolution of the FT-ICR mass spectra of Rh6+ and Rh9+ exposed to 3.0 · 10−7 mbar and 3.1 · 10−7mbar N2 at a temperature of 26 K at various storage times in the cryogenic hexapole ion trap. Note that the N2 adsorption stops after the uptake of 12 and 9 N2, respectively. m/z on the abscissa represents the ‘mass-to charge number ratio’ where the symbol m stands for a dimensionless mass with this symbol m = mass/u.
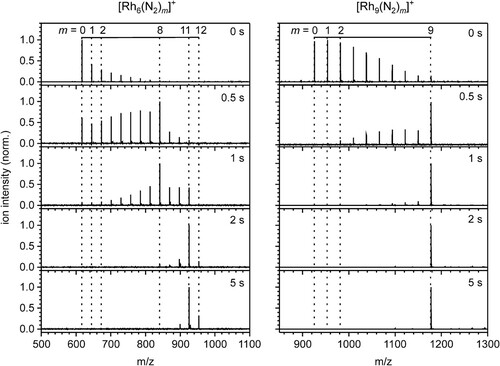
Figure 2. The recorded adsorption limits mmax (purple circles) and the intermittent adsorption limits mx (purple stars) of N2 adsorbates to Rhi+-clusters (in colour only in electronic format). The grey lines indicate adsorbate to cluster size ratios of m: i = (1: 1), (2: 1), namely a monolayer and a double occupation of all rhodium atoms, respectively [Citation47]. Note that in correction to the previous publication ([Citation47], Figure S1 therein), we assign an intermittent adsorption limit (5,7) at m = 7 to the [Rh5(N2)m]+ cluster that is clearly supported by the present kinetic investigations.
![Figure 2. The recorded adsorption limits mmax (purple circles) and the intermittent adsorption limits mx (purple stars) of N2 adsorbates to Rhi+-clusters (in colour only in electronic format). The grey lines indicate adsorbate to cluster size ratios of m: i = (1: 1), (2: 1), namely a monolayer and a double occupation of all rhodium atoms, respectively [Citation47]. Note that in correction to the previous publication ([Citation47], Figure S1 therein), we assign an intermittent adsorption limit (5,7) at m = 7 to the [Rh5(N2)m]+ cluster that is clearly supported by the present kinetic investigations.](/cms/asset/5c9b20b4-e7fb-44af-8640-5d749c2765d7/tmph_a_1953172_f0002_oc.jpg)
Figure 3. Isothermal kinetics of the stepwise N2 adsorption at 26 K (a) by isolated Rh5+ clusters and (b) by isolated Rh6+ clusters (solid symbols, in colour only in electronic format). The fits (solid lines) assume pseudo-first-order kinetics in an adsorption chain of up to 10 consecutive steps for Rh5+ and up to 12 for Rh6+ clusters. Fitted values of relative rate constants (c) of Rh5+ and (d) of Rh6+ for the adsorption (k(i,m), black filled circles) and the desorption (k-(i,m+1), green open circles) as a function of the stepwise N2 adsorption (level m). The grey shaded areas indicate the approximate background noise level. Values of 0.001 s−1 represent an upper limit. Rate constants k(5,10) and k(6,12) are at the noise level and indicate an adsorption limit.
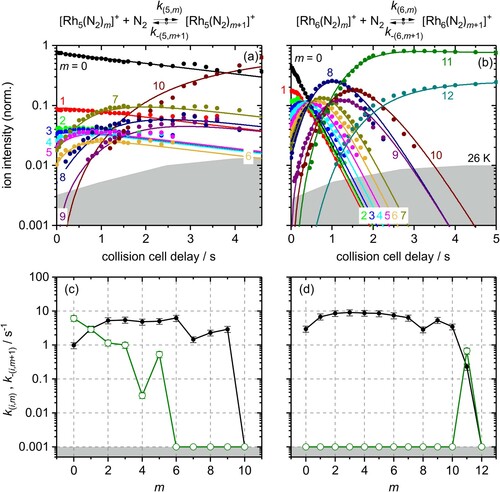
Figure 4. Isothermal kinetics of the stepwise N2 adsorption at 26 K (a) by isolated Rh7+ clusters and (b) by isolated Rh9+ clusters (solid symbols, in colour only in electronic format). The fits (solid lines) assume pseudo-first-order kinetics in an adsorption chain of up to 13 consecutive steps for Rh7+ and up to 9 for Rh9+ clusters. Fitted values of relative rate constants (c) of Rh7+ and (d) of Rh9+ for the adsorption (k(i,m), black filled circles) and the desorption (k-(i,m+1), green open circles) as a function of the stepwise N2 adsorption level m. Values of 0.001 s−1 represent an upper limit. The grey shaded areas indicate the approximate background noise level. Rate constants k(7,13) and k(9,9) are at the noise level and indicate an adsorption limit.
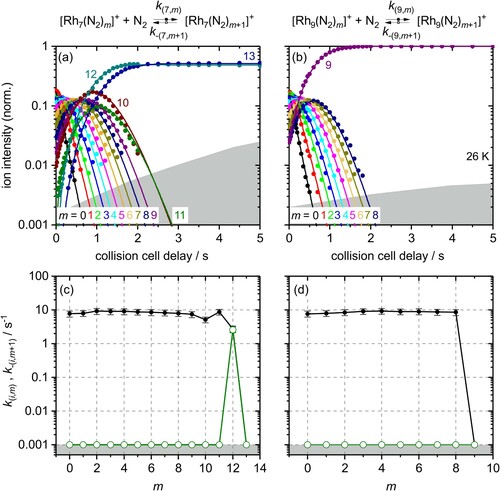
Figure 5. A selection of conceivable Rhi+, i = 5,6,7, and 9, cluster core structures. The number of next neighbours and average coordination numbers for Rh atoms in the clusters are given in Table S16.
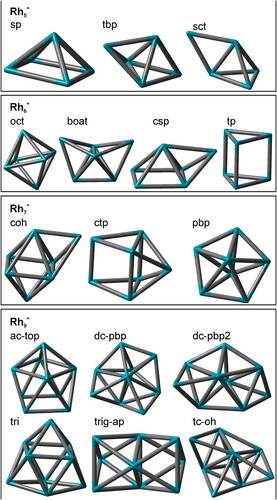
Figure 6. Experimental absolute rate constants for the first adsorption step of Rhi+ with N2 (filled squares) compared to classical Langevin collision rates kcoll (solid line), the ‘Surface Charge Capture model’ kSCC (dashed line), and the ‘Hard Sphere Average dipole orientation model’ kHSA (open circles) [Citation67].
![Figure 6. Experimental absolute rate constants for the first adsorption step of Rhi+ with N2 (filled squares) compared to classical Langevin collision rates kcoll (solid line), the ‘Surface Charge Capture model’ kSCC (dashed line), and the ‘Hard Sphere Average dipole orientation model’ kHSA (open circles) [Citation67].](/cms/asset/d6ba9925-b21e-4e2d-a81e-087f10fcae30/tmph_a_1953172_f0006_ob.jpg)
Table 1. Relative pseudo-first-order rate constants, absolute rate constants, collision rates and sticking probabilities for the N2 adsorption on [Rh5(N2)m]+ clusters. The γ(5,m) values are calculated by Equation (3). The relative errors are 20% for k(5,m) and 40% for kabs and γ(5,m). The kcoll values are theoretically determined.
Table 2. Relative pseudo-first-order rate constants, absolute rate constants, collision rates and sticking probabilities for the N2 adsorption on [Rh6(N2)m]+ clusters. The γ(6,m) values are calculated by Equation (3). The relative errors are 20% for k(6,m) and 40% for kabs and γ(6,m). The kcoll values are theoretically determined.
Table 3. Relative pseudo-first-order rate constants, absolute rate constants, collision rates and sticking probabilities for the N2 adsorption on [Rh7(N2)m]+ clusters. The γ(7,m) values are calculated by Equation (3). The relative errors are 20% for k(7,m) and 40% for kabs and γ(7,m). The kcoll values are theoretically determined.
Table 4. Relative pseudo-first-order rate constants, absolute rate constants, collision rates and sticking probabilities for the N2 adsorption on [Rh9(N2)m]+ clusters. The γ(9,m) values are calculated by Equation (3). The relative errors are 20% for k(9,m) and 40% for kabs and γ(9,m). The kcoll values are theoretically determined.
Figure 7. Plot of Gibbs energies for the equilibria of N2 adsorption onto [Rhi(N2)m]+ / desorption off [Rhi(N2)m+1]+. Note that the
values within the light blue plateau signify upper limits of otherwise unknown values (in colour only in electronic format). The last depicted step formally relates to the equilibrium of mmax with mmax+1. The positive Gibbs energies signify the last adsorption step towards mmax, with the only exception of Rh5+. Its initial N2 adsorption is hindered, and its subsequent steps become more spontaneous. [Rhi(N2)m]+, i = 8, … , 10 possess all negative
values but mmax. The grey area signifies non-occurring processes.
![Figure 7. Plot of Gibbs energies ΔadsG(i,m)26 K for the equilibria of N2 adsorption onto [Rhi(N2)m]+ / desorption off [Rhi(N2)m+1]+. Note that the ΔadsG(i,m)26 K values within the light blue plateau signify upper limits of otherwise unknown values (in colour only in electronic format). The last depicted step formally relates to the equilibrium of mmax with mmax+1. The positive Gibbs energies signify the last adsorption step towards mmax, with the only exception of Rh5+. Its initial N2 adsorption is hindered, and its subsequent steps become more spontaneous. [Rhi(N2)m]+, i = 8, … , 10 possess all negative ΔadsG(i,m)26 K values but mmax. The grey area signifies non-occurring processes.](/cms/asset/a7e5387b-a9ec-4aa1-98e7-ef218ead43d9/tmph_a_1953172_f0007_oc.jpg)
Figure 8. Total energies of most stable Rh5+ cluster structures as a function of the spin multiplicity 2S + 1, normalised to the most stable trigonal bipyramid nonet, 9tbp. The second most stable isomer is a nonet square pyramid, 9sp, +9 kJ/mol. In the cases of high or low multiplicities, a single stable isomer is found (as indicated) while others relax into these. The fully relaxed path of successive spin isomers connects to an asymmetric spin valley (indicated in pink, in colour only in electronic format).
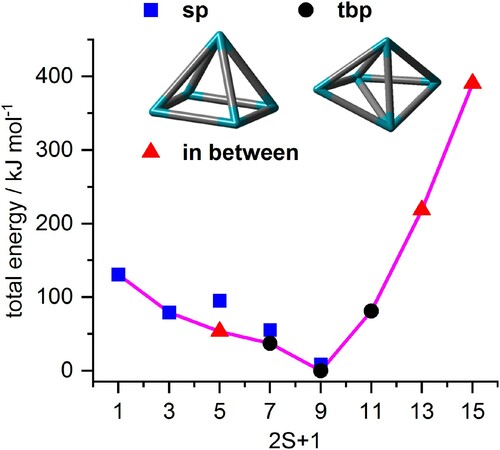
Figure 9. Total energies of computed [Rh5(N2)m]+ cluster adsorbate complex structures (5,m) as a function of the spin multiplicity 2S + 1, normalised to the computed (5,0) spin isomer (trigonal bipyramid, 9tbp, nonet). The calculated minimum structures for (5,0), (5,7) and (5,10) are shown as insets. Spin contamination occurs in some low spin cases (red brackets). The horizontal grey dashed lines serve to interpolate singlet and nonet state energies where no computational data are available. Their offset against each other indicates the supposed average adsorption energy upon spin conservation. The red dashed lines connect the spin valley curves’ minima as indicated by the red circles.
![Figure 9. Total energies of computed [Rh5(N2)m]+ cluster adsorbate complex structures (5,m) as a function of the spin multiplicity 2S + 1, normalised to the computed (5,0) spin isomer (trigonal bipyramid, 9tbp, nonet). The calculated minimum structures for (5,0), (5,7) and (5,10) are shown as insets. Spin contamination occurs in some low spin cases (red brackets). The horizontal grey dashed lines serve to interpolate singlet and nonet state energies where no computational data are available. Their offset against each other indicates the supposed average adsorption energy upon spin conservation. The red dashed lines connect the spin valley curves’ minima as indicated by the red circles.](/cms/asset/8c950f8d-0bec-48cc-b904-8f146ac87846/tmph_a_1953172_f0009_oc.jpg)