
Figures & data
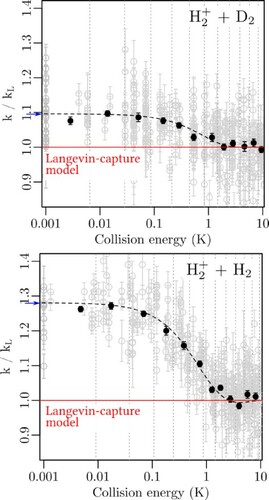
Figure 1. Schematic representation of the merged-beam apparatus used to study the and
reactions at low collision energies, with (i) the source chambers containing pulsed valves emitting supersonic beams of either
or
(
source chamber) and
(
source chamber), (ii) the deflection and reaction chamber containing the photoexcitation zone, where
molecules are photoexcited to Rydberg-Stark states, the Rydberg-Stark deflector and decelerator used to merge the two beams, and the electrode stack surrounding the reaction zone used to extract the product ions, and (iii) the detection chamber where the product-ion yields are monitored using an MCP detector. FIG1 and FIG2 are two fast ionisation gauges used to measure the velocity distribution of the
or
beam. Top left: Example of a sequence of pulsed potentials applied to the three plates of the electrode stack to extract the product ions.
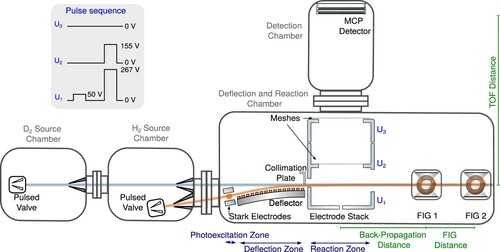
Figure 2. Typical TOF spectra of the products of (a) the and (b) the
reactions measured when operating the TOF-mass spectrometer in Wiley-McLaren conditions. The black and blue traces were recorded with the ground-state beam on and off, respectively. The areas shaded in grey correspond to the integrated
PFI signal used to normalise the product yields and to the integrated product signals (
and
in (a) and
in (b)). The insets display the TOF regions of the
reaction products on an enlarged scale.
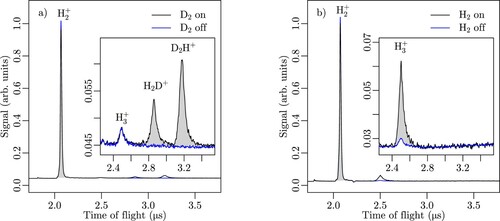
Figure 3. Normalised yield of the
reaction recorded when setting the velocity of the
ground-state beam to the values indicated above the different traces and varying the velocity of the
Rydberg beams using the Rydberg-Stark deflector and decelerator. The data points with error bars (one standard deviation) correspond to the experimental results and the full coloured lines to the results of the simulations described in Subsection 3.4. The slanted dashed line corresponds to equal velocities of the Rydberg and ground-state
beams.
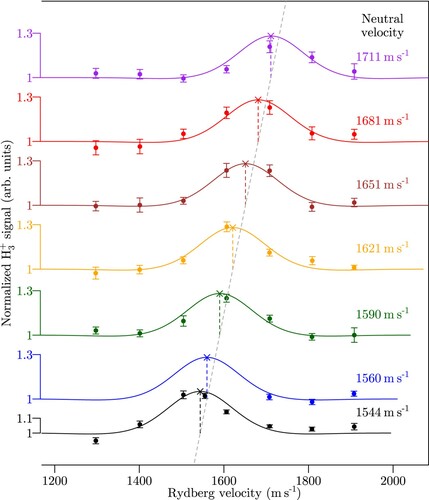
Figure 4. (a) Relative intensities of the (black data points) and
(blue data points) products of the
reaction at low collision energies. The light-blue and gray data points indicate the individual measurements. The red and orange lines represent the simulated detection efficiencies of
and
, respectively, used to determine the branching ratio. (b) Branching ratio of the
reaction channel. The full red lines represent the weighted mean value of the experimental data corrected for the detection efficiency and the dashed red lines the standard deviation.
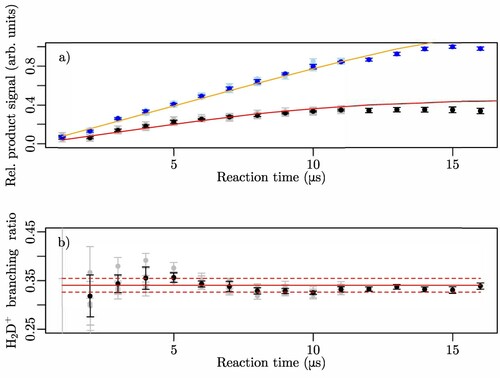
Figure 5. TOF spectra of the products of the reaction measured after reactions times ranging from 1 to 11
when operating the TOF-mass spectrometer so as to obtain information on the product velocity distributions. The signals at about 2.7 and 3.2
correspond to
and
, respectively. The experimental and simulated data are shown as black dashed lines and full coloured lines, respectively. See text for details.
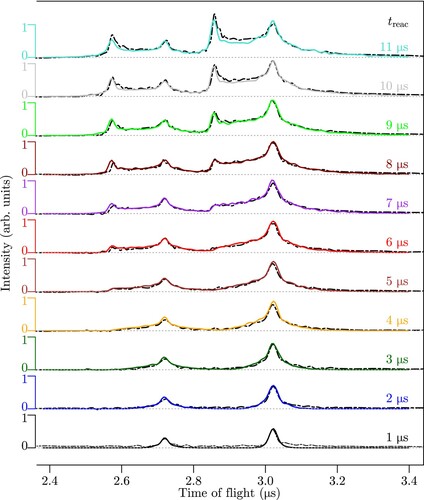
Figure 6. Rate coefficients k relative to the Langevin rate coefficient as a function of the collision energy for a) the reaction
, and b) the reaction
. The grey dots with error bars (one standard deviation) represent individual measurements, the black dots are weighted averages over the regions separated by the dotted grey vertical lines. The dashed black lines correspond to simulations of the experimental results based on the theoretical rate coefficients reported by Dashevskaya et al. [Citation26] for the
reaction, with adequate mass scaling for the
reaction. See text for details.
![Figure 6. Rate coefficients k relative to the Langevin rate coefficient kL as a function of the collision energy for a) the reaction H2++D2, and b) the reaction H2++H2. The grey dots with error bars (one standard deviation) represent individual measurements, the black dots are weighted averages over the regions separated by the dotted grey vertical lines. The dashed black lines correspond to simulations of the experimental results based on the theoretical rate coefficients reported by Dashevskaya et al. [Citation26] for the H2++H2 reaction, with adequate mass scaling for the H2++D2 reaction. See text for details.](/cms/asset/a12fb19a-4708-48a6-83e9-613503c592a0/tmph_a_1954708_f0006_oc.jpg)