
Figures & data
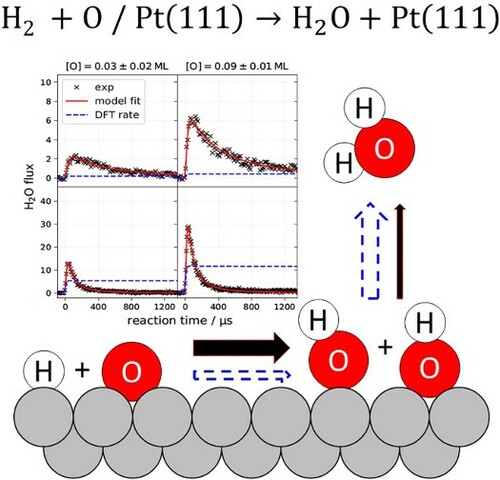
Figure 1. Energy diagram of relevant steps in the H2 oxidation on Pt(111) under conditions where solvation effects are unimportant. The experimental enthalpies at 298 K (black lines) and their uncertainties (grey shaded regions) are reconstructed from Ref. [Citation35]. Calculated energies and barrier heights using the PW91 exchange-correlation functional are shown as purple lines. The calculated energies are without zero-point energy correction.
![Figure 1. Energy diagram of relevant steps in the H2 oxidation on Pt(111) under conditions where solvation effects are unimportant. The experimental enthalpies at 298 K (black lines) and their uncertainties (grey shaded regions) are reconstructed from Ref. [Citation35]. Calculated energies and barrier heights using the PW91 exchange-correlation functional are shown as purple lines. The calculated energies are without zero-point energy correction.](/cms/asset/a9124c08-6798-47cd-997d-d14c613d2c8d/tmph_a_1966533_f0001_oc.jpg)
Figure 2. Kinetic traces of hydrogen oxidation to water on Pt(111) for various , as indicated. Left column: linear plots with insets showing the initial rise. Dashed blue line is the accumulated
beam flux that initiates the reaction. Note the small delay in the onset for all temperatures except 448 K. Right column: linearised second-order plots, i.e.
flux vs. time. Dash-dotted red lines are displayed to guide the eye. The O* coverage is 0.14 ± 0.02 ML in all panels. The H2O flux is peak normalised to 1.
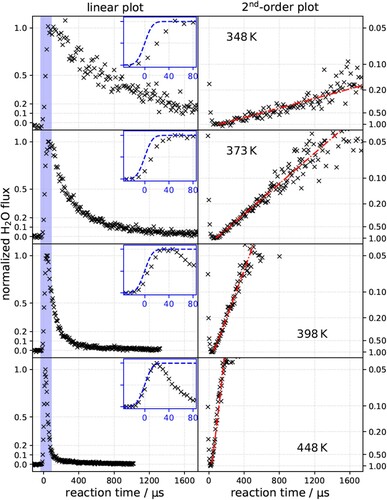
Figure 3. Kinetic traces for hydrogen oxidation to water on Pt(111) for various temperatures and oxygen coverages with comparison to theoretical predictions. The red line shows the results of a simplified three-step kinetic model fit individually to experimental data (×) for each set of conditions. The blue dashed line shows the predictions of the standard mechanism using DFT and TST derived rate constants. The integral of experimental data over reaction time reflects the relative H2O yield, which increases with temperature and oxygen coverage. The rate of the standard mechanism is uniformly but arbitrarily scaled to compare to relative H2O fluxes obtained experimentally.
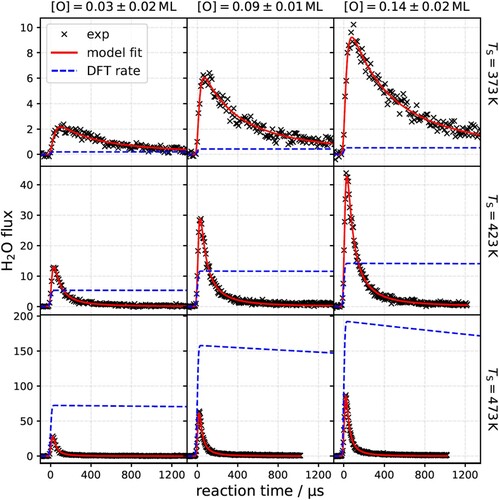
Figure 4. Reaction rate constants (symbols) derived from the simplified three-step kinetic model. Red and black dashed lines are the Arrhenius fits. The Arrhenius rate parameter derived for initiation rate constant are
and
and for the 2nd order rate-limiting water production rate constant,
, are
and
.
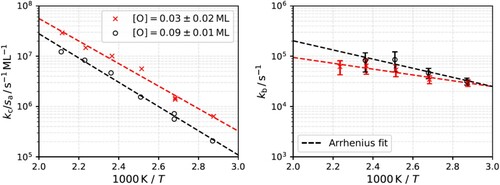
Figure 5. Experimentally derived water yield vs. surface temperature and oxygen coverage. The yield is obtained by integrating the kinetic trace over all velocities and time. The absolute yield per hydrogen molecule could be obtained if the absolute flux of water were known. Here the scaling of H2O yield is arbitrary.
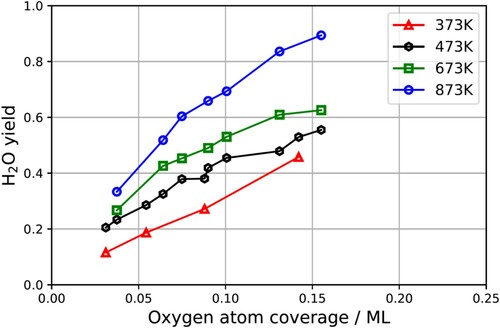
Table 1. Adsorption energies of O*, H* and OH* on Pt(111) determined using the PW91 exchange-correlation functional.
Table 2. Reaction energies (ΔE) and barrier heights (E) for elementary steps in the hydrogen oxidation reaction on Pt(111) determined by DFT calculations.
Table 3. Arrhenius rate parameters based on DFT calculations that we used to simulate the rate of H2 oxidation on Pt(111) (see blue dashed line of Figure ).