
Figures & data
Table 1. The optimised Gaussian exponents of atomic orbitals s, p, and d for sodium and potassium atoms.
Table 2. Asymptotic values and , i.e. the difference between the obtained results and the experimental data [Citation39,Citation40,Citation42].
Figure 1. Adiabatic potential energy curves of the NaK molecule for five states with symmetry .
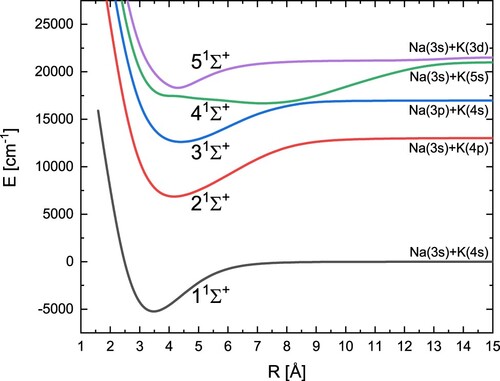
Figure 2. (a) The comparison of the current results of the adiabatic potential energy curves with the potentials derived from experimental data [Citation25,Citation27,Citation28] for the 3–5 (the graph is scaled by the value of the bond energy for the present ground state), (b) error plot, i.e. the value of the difference between the current results and the experimental data [Citation25,Citation27,Citation28] for given distances.
![Figure 2. (a) The comparison of the current results of the adiabatic potential energy curves with the potentials derived from experimental data [Citation25,Citation27,Citation28] for the 3–51Σ+ (the graph is scaled by the value of the bond energy for the present ground state), (b) error plot, i.e. the value of the difference between the current results and the experimental data [Citation25,Citation27,Citation28] for given distances.](/cms/asset/d0cd21c5-f756-481b-a9f4-039af0254295/tmph_a_2040628_f0002_oc.jpg)
Table 3. Spectroscopic constants of the ground and excited states.
Figure 3. Adiabatic energy curves of the NaK molecules for three states with symmetry and one state with symmetry
.
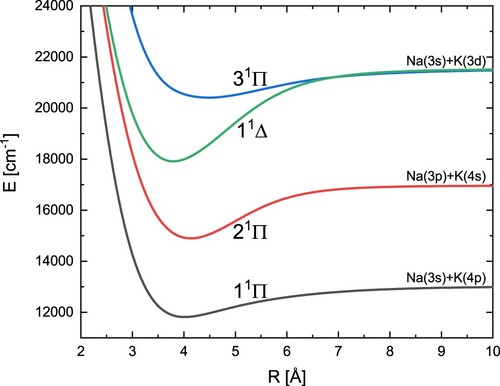
Table 4. Spectroscopic constants of the excited and
states.
Figure 4. Adiabatic potential energy curves of the NaK molecule for five states with symmetry .
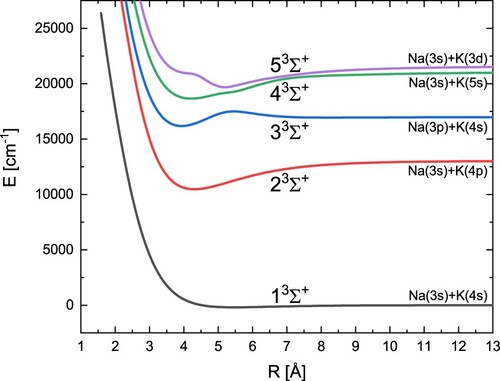
Table 5. Spectroscopic constants of the excited states.
Figure 5. Adiabatic potential energy curves of the NaK molecule for three states with symmetry and one state with symmetry
.
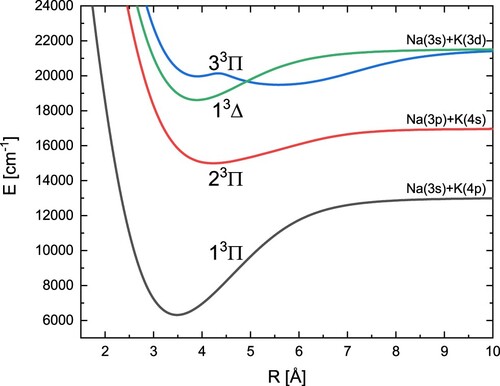
Table 6. Spectroscopic constants of the excited and
states.