
Figures & data
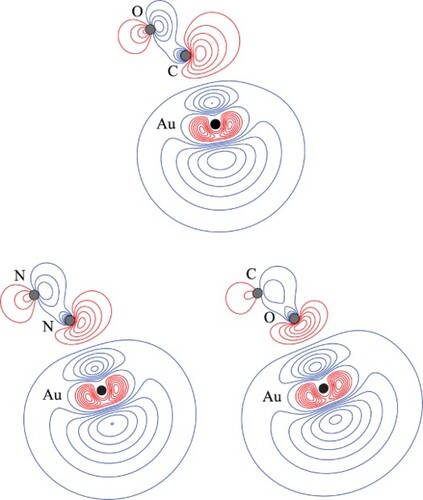
Table 1. Optimised geometries and vibrational wavenumbers of the T-Shaped cationic CM+–H2 complexes (CM = Cu, Ag, Au)Table Footnotea.
Table 2. Optimised geometries and vibrational wavenumbers of the cationic CM+–CO complexes (CM = Cu, Ag, Au)Table Footnotea.
Table 3. Optimised geometries and vibrational wavenumbers of the cationic CM+–N2 complexes (CM = Cu, Ag, Au)Table Footnotea.
Table 4. Interaction energies (cm–1) for the CM+–L complexesTable Footnotea.
Table 5. Calculated atomic charges and H(RC) parameters for CM+–L using different methodsTable Footnotea.
Table 6. Electrostatic quantities for H2, N2 and COTable Footnotea.
Figure 1. Molecular orbital diagram for Au+–H2. See text for details. The contours are the same for all molecular orbitals shown. For H2, the calculated orbital energy of the 1sσg orbital in the absence of the coulombic field arising from the metal atom is indicated in grey, while the solid line indicates its energy in the presence of the field. The position of the gold nucleus is indicated by a black dot, and that of the hydrogen nuclei by grey dots. Orbitals lie in the yz plane unless indicated by the presence of axes, where these axes are located on the Au+. In the latter cases, one or more of the hydrogen atoms may not be visible.
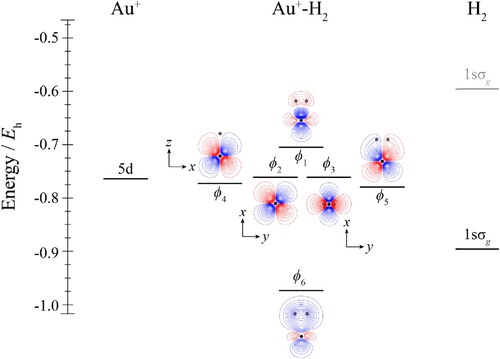
Figure 2. Molecular orbital diagram for Au+–CO. See text for details. The contours are the same for all molecular orbitals shown. For CO, the calculated orbital energies of the 2pσ and 2pπ orbitals in the absence of the coulombic field arising from the metal atom are indicated in grey, while the solid line indicates their energy in the presence of the field. The position of the gold nucleus is indicated by a black dot, and that of the carbon and oxygen nuclei by grey dots, with the carbon atom the one closest to the gold. Orbitals lie in the yz plane unless indicated by the presence of axes, where these axes are located on the Au+. In the latter cases, one or more of the CO atoms may not be visible.
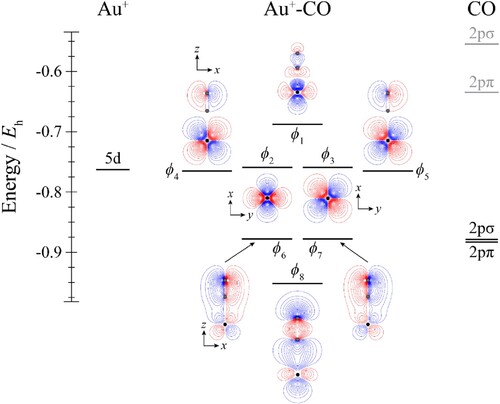
Figure 3. Molecular orbital diagram for Au+–N2. See text for details. The contours are the same for all molecular orbitals shown. For N2, the calculated orbital energies of the 2pσg and 2pπu orbitals in the absence of the coulombic field arising from the metal atom are indicated in grey, while the solid line indicates their energy in the presence of the field. The position of the gold nucleus is indicated by a black dot, and that of the nitrogen nuclei by grey dots. Orbitals lie in the yz plane unless indicated by the presence of axes, where these axes are located on the Au+. In the latter cases, one or more of the nitrogen atoms may not be visible.
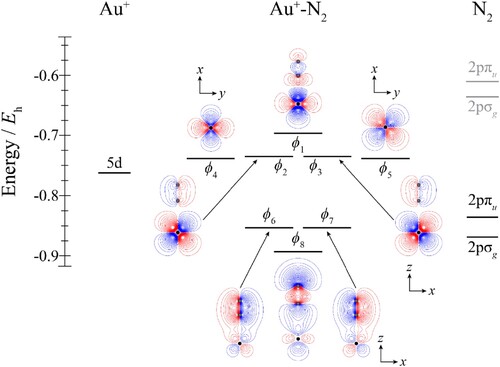
Figure 4. Contour plots for the HOMOs of the CM+–L complexes. See text for further comment and discussion. The position of the gold nucleus is indicated by a black dot, and that of the ligand nuclei by grey dots; in the case of CM+–CO, the carbon atom is closest to the gold. All orbitals lie in the yz plane.
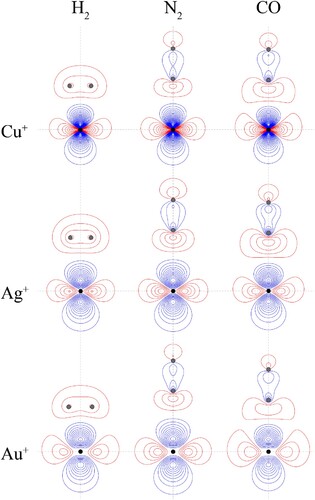
Table 7. Optimised geometries and vibrational wavenumbers of the linear CM–H2 complexes (CM = Cu, Ag, Au)Table Footnotea.
Table 8. Optimised geometries and vibrational wavenumbers of the neutral CM–CO complexes (CM = Cu, Ag, Au)Table Footnotea.
Table 9. Optimised geometries and vibrational wavenumbers of the neutral CM–N2 complexes (CM = Cu, Ag Au)Table Footnotea.
Figure 5. Molecular orbital diagram for Au–H2. See text for details. The contours are the same for all molecular orbitals shown. The position of the gold nucleus is indicated by a black dot, and that of the hydrogen nuclei by grey dots. Orbitals lie in the yz plane unless indicated by the presence of axes, where these axes are located on the Au. In the latter cases, one or more of the hydrogen atoms may not be visible.
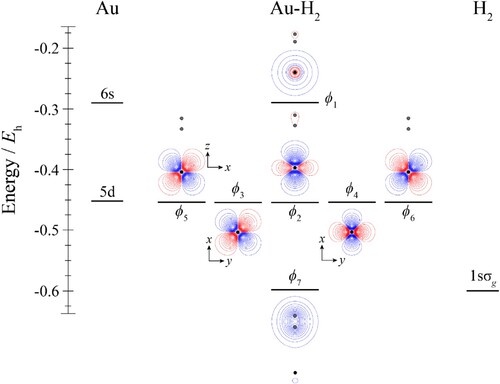
Figure 6. Molecular orbital diagram for Au–CO. See text for details. The contours are the same for all molecular orbitals shown. The position of the gold nucleus is indicated by a black dot, and that of the carbon and oxygen nuclei by grey dots, with the carbon atom the one closest to the gold. Orbitals lie in the yz plane unless indicated by the presence of axes, where these axes are located on the Au. In the latter cases, one or more of the CO atoms may not be visible.
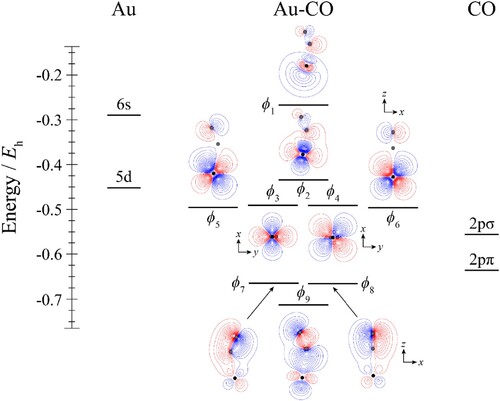
Figure 7. Molecular orbital diagram for Au–N2. See text for details. The contours are the same for all molecular orbitals shown. The position of the gold nucleus is indicated by a black dot, and that of the nitrogen nuclei by grey dots. Orbitals lie in the yz plane unless indicated by the presence of axes, where these axes are located on the Au. In the latter cases, one or more of the nitrogen atoms may not be visible.
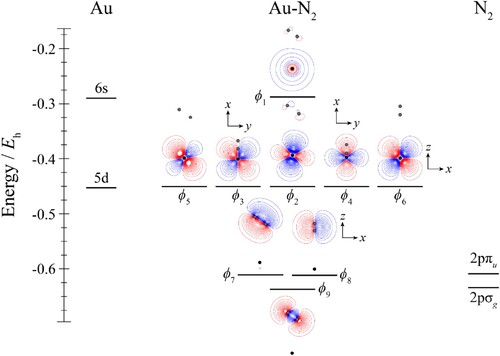
Figure 8. Contour plots for the HOMOs of the CM–L complexes. See text for further comment and discussion. The position of the gold nucleus is indicated by a black dot, and that of the ligand nuclei by grey dots; in the case of CM–CO, the carbon atom is closest to the gold. All orbitals lie in the yz plane.
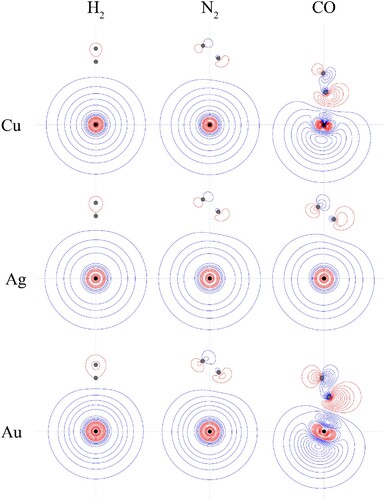
Figure 9. Contour plots of the HOMOs of the indicated CM–L complex, at the indicated geometry. The Au–L//Au–L′ notation employed indicates that the contours of Au–L are shown, calculated at the optimised geometry of Au–L′, with the latter calculated at the MP2 level of theory using the triple–ζ quality basis sets described in the main text. The position of the gold nucleus is indicated by a black dot, and that of the ligand nuclei by grey dots; in the case of Au–CO, the carbon atom is closest to the gold. All orbitals lie in the yz plane. See text for further discussion.
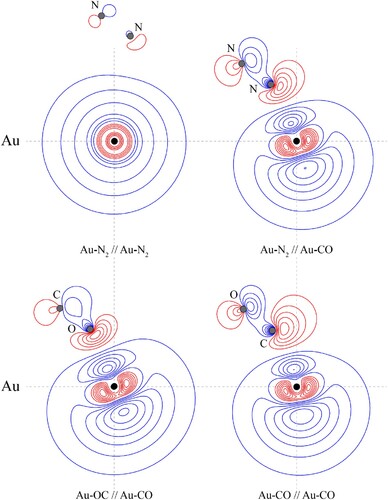
Table 10. Interaction energies (cm–1) for the CM–L complexesTable Footnotea.
Table 11. Calculated atomic charges (Q), spin densities (ρ), and H(RC) parameters for CM–L using different methodsTable Footnotea.
Table 12. Calculated interaction energies (cm–1) for the CM(+)–RG complexesTable Footnotea.
Supplementary Material
Download MS Word (45.7 KB)Data availability statement
The data that support the findings of this study are available from the corresponding author upon reasonable request.