
Figures & data
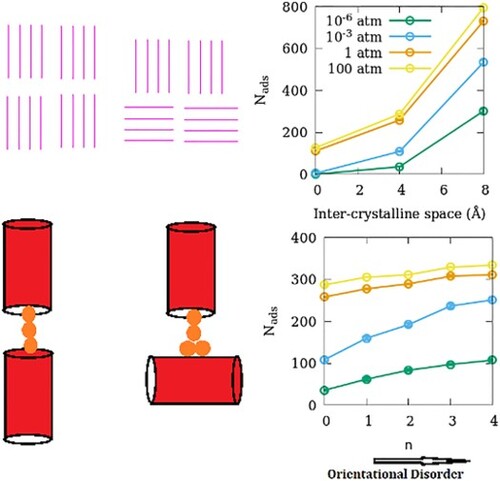
Figure 1. (a) Simulation snapshot for the perfect crystal system ZSM-22 (NG-OD0) with SO2 adsorbed at a partial gas pressure of 100 atm. Si, O and S atoms are shown as spheres of blue, red and yellow colour, respectively. (b) Simulation snapshot of SO2 adsorbed in the disordered ZSM-22 system SG-OD4 at 100 atm. Individual crystallites are separated from each other by inter-crystalline spacing shown in light blue whereas channel-like pores in the crystallites are marked in light magenta. (c) Schematic representation of the pore network in some ZSM-22 models. Out of a total of eight crystallites, only four that are visible from front are shown. Channel-like pores are shown as single magenta lines. In NG-OD0, all crystallites are stacked on top of each other so that channels belonging to two vertically adjacent crystallites form one single channel. In LG-OD0 (and similarly, in SG-OD0 not shown here), individual crystallites have space between them resulting in a discontinuation of channels. In LG-OD1, one crystallite can be seen disoriented (horizontal instead of vertical lines in the bottom right crystallite). The number of crystallites disoriented in this fashion increases in LG-OD2, LG-OD3 and LG-OD4 resulting in an increase in OD. Note that the crystallites at the back (not shown) retain their original orientation. Thus, in LG-OD4, all four crystallites visible in front have an orientation different from the four crystallites at the back (not visible).
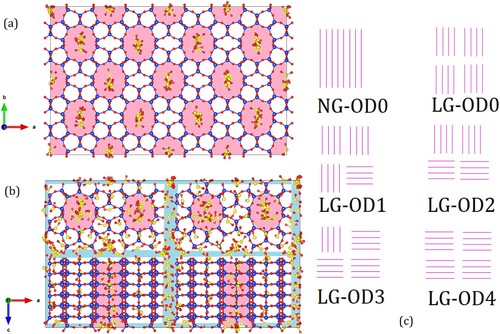
Table 1. Models of ZSM-22 used in the simulations.
Table 2. Force-field parameters of atoms belonging to ZSM-22 (first two rows) and SO2 (bottom two rows) used in the simulations.
Figure 2. Adsorption isotherms of SO2 at 300 K in ZSM-22 models with (a) different inter-crystalline spacings and uniform orientation, (b) small inter-crystalline space and different degrees of OD and (c) large inter-crystalline space and different degrees of OD.
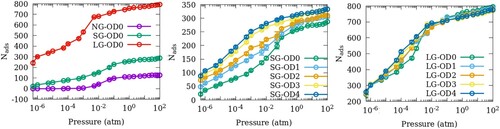
Figure 3. Pair distribution functions belonging to the guest–guest (S–S and Os–Os) and guest-zeolite (X–Si and X–O; X = Si/Os) pairs in (a,b) perfect ZSM-22 crystal without inter-crystalline gap, (c,d) ZSM-22 with a small inter-crystalline gap (SG) and (e,f) ZSM-22 with large inter-crystalline gap (LG). In (c–f), data corresponding to orientationally ordered ZSM-22 (OD0) are represented by lines while those corresponding to orientationally disordered ZSM-22 (OD4) are shown with open circles.
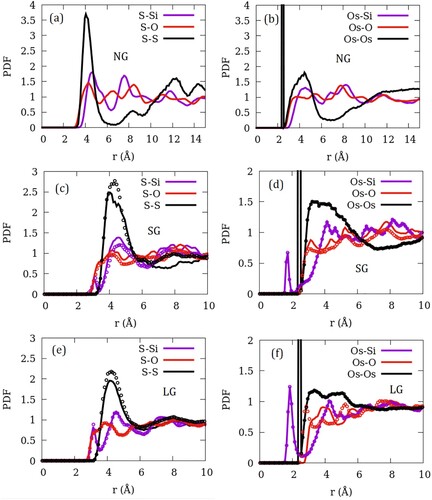
Figure 4. Angular distribution of SO2 molecules in ZSM-22 with respect to the Cartesian Z-direction. Distribution of angles made by the Os–Os vector is shown in the left panel while that made by the bisector of Os–S–Os angle is shown in the right panel. The definition of the two angles is illustrated in the middle panel.
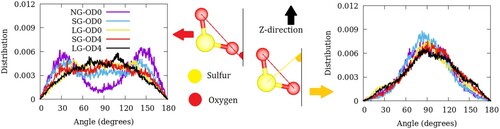
Figure 5. Distribution of the centre of mass of SO2 molecules in NG-OD0 model of ZSM-22 in the X–Z plane. The intensity represents the number of molecules in an 8 Å thick slice of the X–Z plane summed over 200 configurations of the simulated system. The right panel is an enlarged region of the left plot.
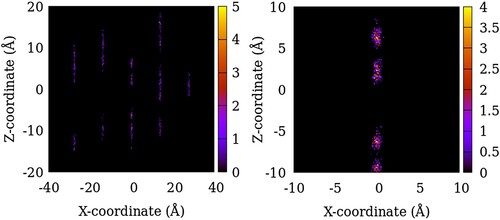
Figure 6. Distribution of the centre of mass of SO2 molecules in SG-OD0 (left) and SG-OD4 (right) models of ZSM-22 in the X–Z plane. The intensity represents the number of molecules in an 8 Å thick slice of the X–Z plane summed over 200 configurations of the simulated system.
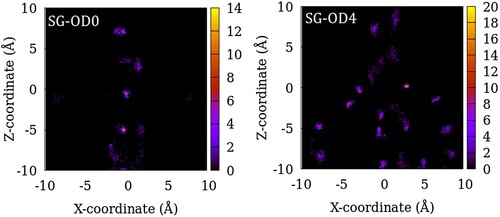
Figure 7. Distribution of the centre of mass of SO2 molecules in LG-OD0 (left) and LG-OD4 (right) models of ZSM-22 in the X–Z plane. The intensity represents the number of molecules in an 8 Å thick slice of the X–Z plane summed over 200 configurations of the simulated system.
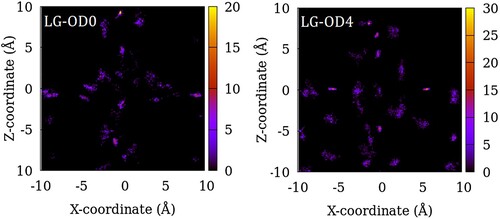
Figure 8. (a) Effect of inter-crystalline spacing on the adsorption amounts of SO2 in ZSM-22 models. The effects of OD in SG-ODn and LG-ODn models are shown in (b,c), respectively. All three sub-figures share the same legend that is included in (a).
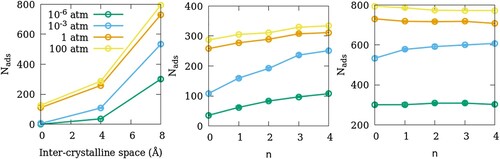
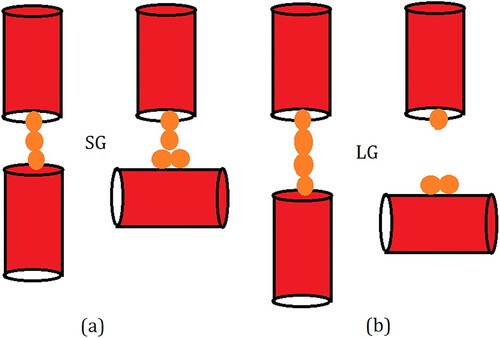
Figure 9. Schematic illustration explaining the variation of adsorption amount with OD of the adsorbent in (a) SG and (b) LG models. For simplicity, zeolite channels are represented as red cylinders while the guest molecules are shown as yellow spheres. Due to the strong guest–guest interactions, the chain of molecules adsorbed in the straight channels remains intact even when a small gap is introduced between the channels as inter-crystalline spacing (left, a). When a channel is rotated in a crystallite increasing OD, the strong guest–crystallite surface interactions compensate for the break in the channel and the chain remains intact (right, a). In case the inter-crystalline spacing is larger, the strong guest–guest interaction is still able to compensate for the break in channel continuity (left, b) but when the channel is rotated, this chain breaks and hence the inter-crystalline space has a lower guest density (right b).
Data availability statement
All data supporting the findings of this study are available within this article.