Figures & data
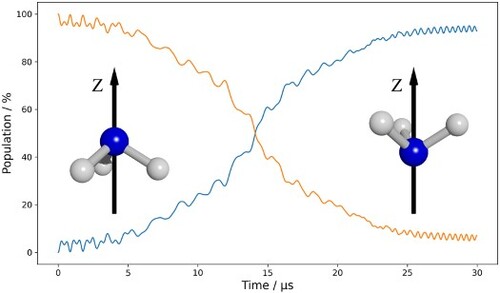
Figure 1. Schematic overview of the experimental set-up, consisting of: (1) the last stage of the 2.6 m long Stark decelerator, (2) a microwave antenna pointing along the Stark axis, (3) a pair of deflector electrodes, (4) an ionisation laser and an electrode stack with MCP to detect the formed ions. The distance between various components are given in mm.
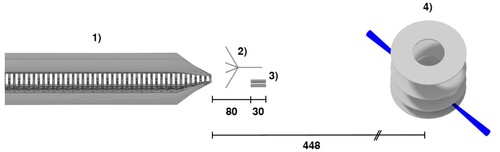
Figure 2. Illustration of the functional principle of the deflector electrodes. Depicted are trajectories of ND molecules in the
(blue),
(red), and
(green) states. If
the molecules get deflected from the beam axis.
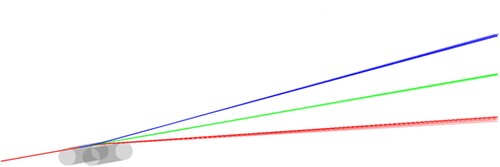
Figure 3. Prediction for the upper state populations (orange) and lower state populations (blue) of the OH lambda doublet transition as a function of time. Equal population of all five
states of the upper lambda doublet levels is assumed at the beginning of the pulse. Single frequency pulses resonant at
, chirps from
to
. Predictions made for a power density of
.
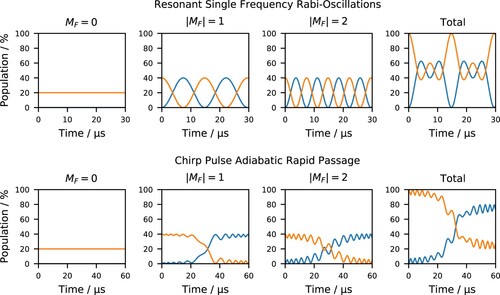
Figure 4. Predictions of the inversion transition of the
system. Chirp from 1587.050 to
assuming equal population of all 72 levels of the upper (−) inversion component at the beginning of the pulse. A power density of
was used in the simulations. (a) Total population in all hyperfine components within the
(orange) and
(blue) levels as a function of time. (b) Population of the
component of
as a function of time.
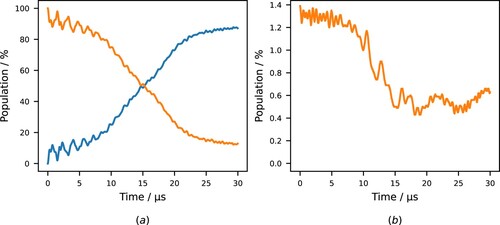
Figure 5. Stark shifts of hyperfine levels in dependence of electric field on two different scales. At energy levels belonging to the
and
manifold of
show avoided crossings. At high fields the nuclear spins decouple, such that
becomes a good quantum number.
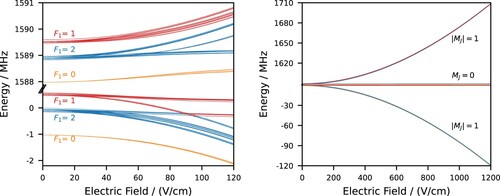
Figure 6. Predictions of population transfers inside of a electric field starting with a pure low-field seeking population of
of
with
(
) in orange (blue). From left to right: (a) Energy level diagram with approximate resonant transition frequencies. (b) Population transfer curve for a
chirp running over the
resonance using X-polarised radiation. (c) Population transfer curve for a
chirp running over the
resonance using Z-polarised radiation.
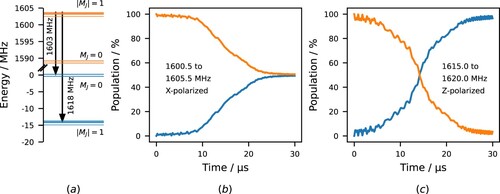
Figure 7. Spectra recorded by stepping single frequency pulses, starting at
and ending at
with step size of
. Signal recorded on the
(
) REMPI resonance in orange (blue). Each peak is labelled by the
quantum numbers of the initial and final states involved in the transition. (a) 100 samples per step. Spectrum recorded with Stark decelerator in normal operation together with prediction (black) using the von Neumann equation at a power of −6 dBm for the inside antenna (corresponding to a power density of
). (b) 50 samples per step. Spectrum recorded with extended fringe field of the Stark decelerator and using the outside antenna radiating through a glass view-port into the machine at
(about
). (c) 50 samples per step. Spectrum recorded using a first pump pulse (CP_CROSS in Table ) with the inside antenna at
in the fringe field between the end of the Stark decelerator and the deflector electrodes, followed by a probe pulse at
after the molecules passed the deflector. In (b) and (c) each peak is additionally labelled with
to show the high-field behaviour of the initial state's population (see Figure ).
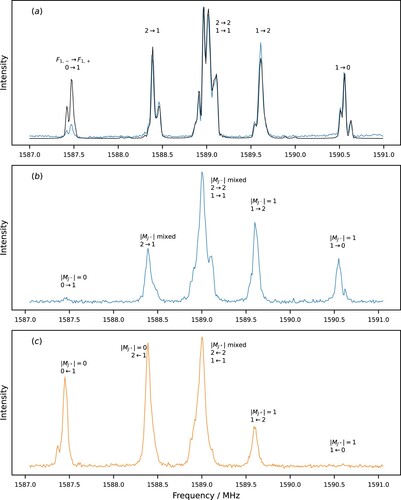
Table 1. Population transfer in electric fringe field of decelerator and deflector.
Figure 8. Population transfer between the two inversion components of ND
for a
chirp from 1587.050 to
. Population of
in orange and of
in blue.
on signal generator corresponds to ≈50 W/m
in power density. Experimental and theoretical results are represented by solid and dashed lines, respectively. (a) As a function of time at
calculating
population from
depletion with a step size of
and 250 samples per step. (b) As a function of power on the signal generator, here the
population was derived measuring and converting the
signal. Each step 1000 samples were used for
as well as
signal. Error bars are
.
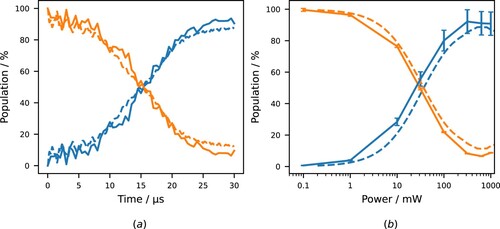
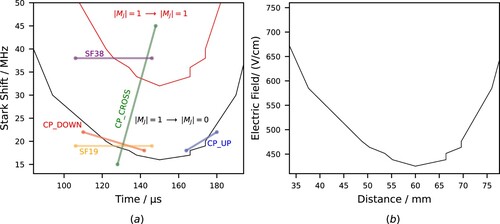
Figure 9. (a) Stark shift induced by the fringe fields of the Stark decelerator and deflector electrodes as a function of time of flight from the geometrical end of the Stark decelerator. Black line marks the frequency for resonant transitions. Red line marks the transitions for
. The five different pulses, that were tested for their performance are shown. The performance of these pulses is compared in Table . (b) Time of flight and detuning were translated into electric field in dependence of distance from the Stark decelerator.