
Figures & data
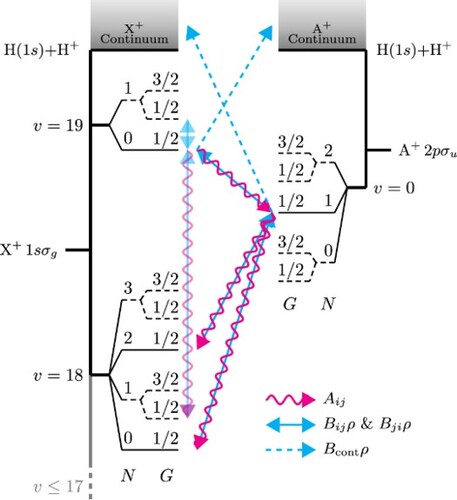
Figure 1. Energy-level diagram of the weakly bound states of H. The ground electronic state, X
, is depicted on the left-hand side, displaying the dissociation continuum on the top and the two highest vibrational levels. Levels with v = 13−17 are not shown for clarity but are taken into account in the calculation On the right-hand side, the first excited electronic state, A
, is shown with a single vibrational level, v = 0, and the dissociation continuum. For both electronic states, the rotational levels denoted with a dashed line are the ortho-levels with I = 1. The arrows represent a simplified version of the transitions present for para-H
with the whole population starting in the X
(
) level; wavy red lines indicate spontaneous emission, the double-headed solid blue lines show stimulated emission and absorption, and the single-headed dashed blue line stands for absorption into the continuum (all states experience absorption into the continuum, but only a few are explicitly shown). The forbidden transitions, allowed by g/u-mixing, are also shown. Neglecting spin-rotation interactions, the levels F are degenerate and not shown.
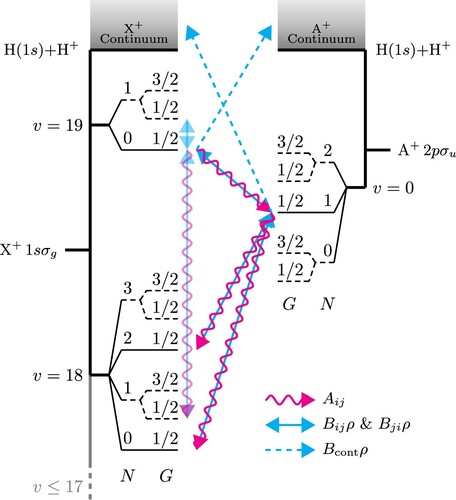
Figure 2. (a) Bound-bound A – X
stick spectrum of H
, with the labels indicating the vibrational bands. The forbidden transitions (allowed by g/u-mixing) are indicated as dashed lines. (b) Photodissociation cross-section for X
(solid line) and A
(dash-dotted line). For comparison, X
is also shown. (c) Black-body photon density at room (solid line) and at liquid nitrogen (dashed line) temperature. See text for details.
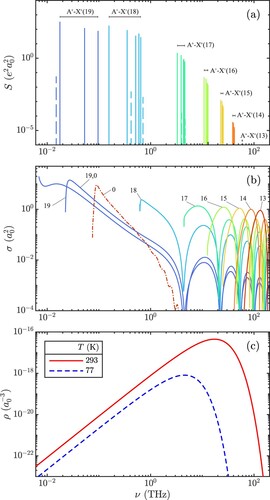
Figure 3. Time evolution of the rovibronic state populations at 293 K with the ions selectively prepared in: (a) Para-X with no g/u-mixing. (b) Para-X
including g/u-mixing. Labels are added to the now-accessible ortho-states and the repeated labels from panel (a) are omitted. (c) Ortho-X
without g/u-mixing. (d) Ortho-X
with g/u-mixing.
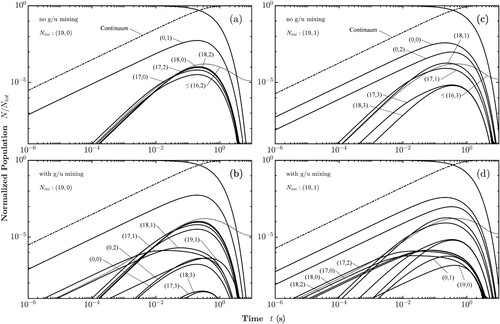
Figure 4. Time evolution of the rovibronic state populations at 77 K with the ions selectively prepared in: (a) Para-X with no g/u-mixing. (b) Para-X
including g/u-mixing. Labels are added to the now-accessible ortho-states and the repeated labels from panel (a) are omitted. (c) Ortho-X
without g/u-mixing. (d) Ortho-X
with g/u-mixing.
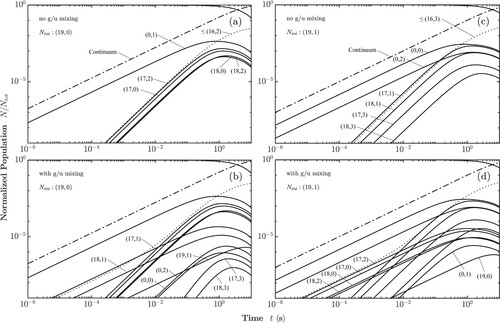
Figure 5. Effective lifetimes of the weakly bound states of H. A line is drawn connecting states with N = 0; dashed blue line for 77 K, solid orange line for 293 K and dash-dotted red line for 400 K.
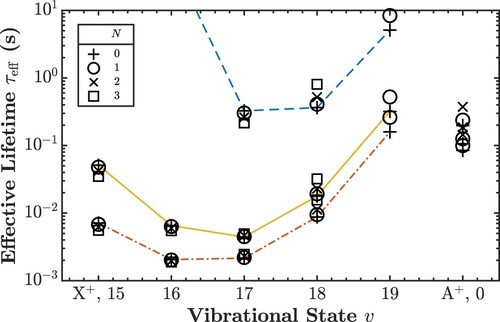
Table 1. Effective lifetimes of the weakly bound states of H at 293 K. Level v = 0 corresponds to A
, the other levels to X
.
Table 2. Effective lifetimes of the weakly bound states of H at 77 K. Level v = 0 corresponds to A
, the other levels to X
.
Table 3. Effective lifetimes of the weakly bound states of H at 400 K. Level v = 0 corresponds to A
, the other levels to X
.
Table B1. Effective coupling constants of the Fermi interaction for the weakly bound states of H in X
.
Table B2. Effective coupling constants of the Fermi interaction for the weakly bound states of H in A
.
Table C1. Bound-bound line strengths and Einstein rate coefficients of the weakly bound states of H for transitions involving A
.
Table C2. Bound-bound line strengths and Einstein rate coefficients of the weakly bound states of H for transitions involving A
.
Table C3. Bound-bound line strengths and Einstein rate coefficients of the weakly bound states of H for transitions involving A
.
Table C4. Continuum absorption rates of the weakly bound states of H at 293 K.
Table C5. Continuum absorption rates of the weakly bound states of H at 77 K.