
Figures & data
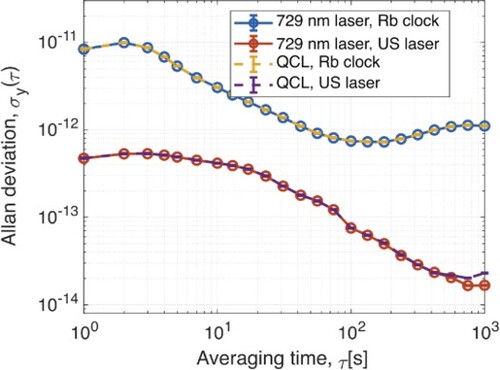
Figure 1. Stabilisation setups for the optical frequency comb (OFC) and the quantum cascade laser (QCL). The OFC was phase locked to an optical-cavity-stabilised 729 nm master laser with emission frequency . An ultrastable (US) reference laser at a frequency
corresponding to 1572.06 nm, generated at the Swiss Institute of Metrology METAS, was transferred to our laboratory at the University of Basel via a 123 km long phase-stabilised fibre link, where it was employed to measure and compensate drifts of the ultralow-expansion (ULE) cavity for the master laser. The beat notes of the OFC with the 729 nm master laser and the US laser (
and
, respectively) were detected using beat-detection units. The mid-infrared (MIR) QCL, emitting at a frequency
, was then phase locked to the OFC after upconversion of its frequency to the visible domain (
) by sum-frequency generation (SFG) with amplified emission from the master laser in a periodically poled lithium niobate (PPLN) crystal. The beat note between the QCL and the OFC was generated in a balanced photo-detection setup. See text for further details.
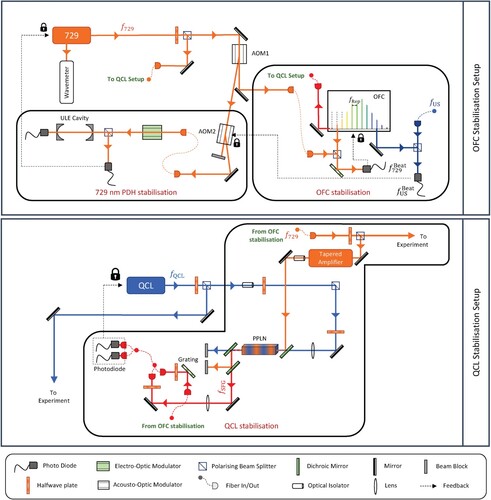
Figure 2. (A) In-loop beat note of the 729 nm master laser with the OFC. The beat note exhibits a signal-to-noise ratio dB measured with a 10 kHz resolution bandwidth. (B) Magnification of the central feature in panel A. The linewidth of the beat note of the locked laser was determined to be
Hz limited by the resolution bandwidth of the spectrum analyser employed.
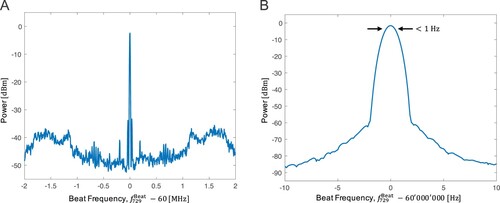
Figure 3. (A) Out-of-loop beat note between the stabilised OFC and the US laser generated at METAS and delivered to the University of Basel via 123 km of optical fibres. The beat note exhibits a linewidth of 2 kHz. (B) Frequency-noise power spectral density (FNPSD) of the round trip phase-noise-cancellation (PNC) system measured in Berne. The portion of the spectrum above the black β-separation line (red shaded area) contributes to the noise of the linewidth observed in panel A.
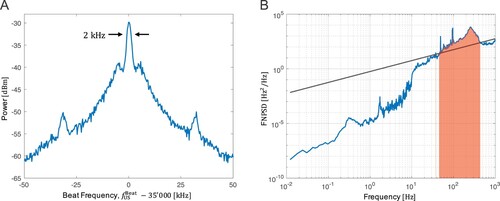
Figure 4. (A) Beat note of the free-running QCL with the OFC measured at a resolution bandwidth of 30 kHz (blue trace). A linewidth (FWHM ) of 500 kHz was determined for the laser from a 20-point running average of the signal (orange trace). (B) In-loop beat note of the QCL locked to the OFC (orange trace). A signal-to-noise ratio of 26 dB was observed at a 30 kHz resolution bandwidth. The signal was further filtered by locking two tracking oscillators to the beat note (see text). The spectrum of one of the oscillators is shown as the blue trace. (C) Beat note of the locked QCL with the OFC measured at a resolution bandwidth of 1 Hz. A FWHM linewidth of Hz was observed, limited by the resolution of the spectrum analyser.
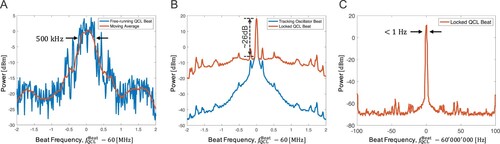
Figure 5. Allan deviations of the 729 nm master laser and QCL frequencies determined by two methods. In the measurements shown in the blue and yellow traces, the GPSD Rb clock was employed as master oscillator in the determination of the frequencies of both lasers. The stabilities of the laser frequencies obtained by referencing to the remote US laser are shown in the orange and violet traces. Slight differences between the 729 nm laser and the QCL at 800–1000 s averaging time are most likely due to measurement statistics.

Data availability statement
The data that support the findings of this study have been deposited in Zenodo with the identifier https://doi.org/10.5281/zenodo.7035071.