Figures & data

Figure 1. (A) Computed SCKH spectra of D1A1 (black) and D2A2 (red) pentamers. The peaks are labelled with the corresponding molecular valence orbitals from which they derive. (B) The same as in (A) but without the dynamics, i.e. spectra computed for the initial geometry of each trajectory and then summed for each of the D1A1 and D2A2 models.
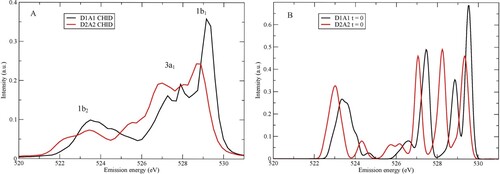
Figure 2. (A) Decomposition of the fitted XES spectrum (black) from ref. [Citation64] in terms of number of donated H-bonds. The decomposition into contributions from D0 (red), D1 (green) and D2 (blue) species is shown. (B) The corresponding spectrum contributions without CHID.
![Figure 2. (A) Decomposition of the fitted XES spectrum (black) from ref. [Citation64] in terms of number of donated H-bonds. The decomposition into contributions from D0 (red), D1 (green) and D2 (blue) species is shown. (B) The corresponding spectrum contributions without CHID.](/cms/asset/8a58f3ec-d5dd-48f4-88f3-e20d1d62b704/tmph_a_2170686_f0002_oc.jpg)
Figure 3. Time-evolution of internal OH-bond-lengths with CHID for (A) D2A2 and (B) D1A1 model pentamers.
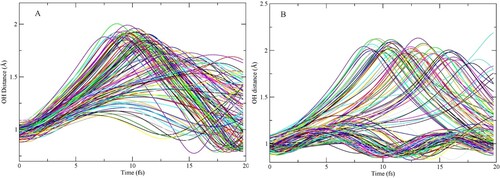
Figure 4. (Left) Initial pentamer structure defining H-bond donors (W2, W5) and acceptors (W3, W4) with respect to the central molecule. The D2A2 and D1A1 model pentamers differ in the W4, W5 bond lengths, which are elongated for the D1A1 species. (Right) Example snapshot after 8 fs of a D2A2 trajectory where both protons are significantly distanced from the oxygen.
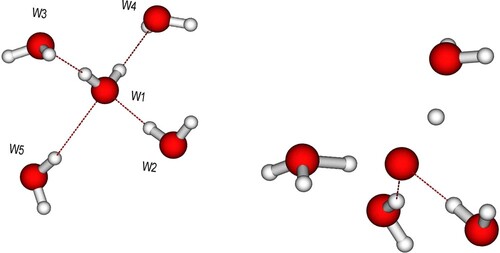
Figure 5. Time evolution of O-O distances for the (A) D2A2 and (B) D1A1 model pentamers. Donor molecules (W2, W5) in Figure move to larger distance while acceptors (W3, W4) are attracted to the central oxygen as the proton(s) move towards the acceptor. The difference in initial elongated donor and acceptor distance (3.4 vs 3.8 Å) for the D1A1 species is due to the optimisation, where the central molecule has been free to move towards the acceptor; the further spread around these distances is due to the sampling of the zero-point distribution (including translations) of the central molecule.
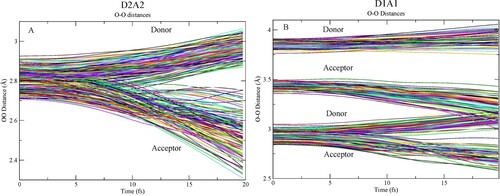
Figure 6. Charge on individual waters as function of time along two example CHID trajectories. (A) D2A2 pentamer and (B) D1A1 pentamer.
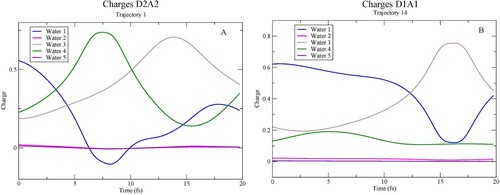
Figure 7. Mulliken charge on each of the atoms in the central molecule as a function of time along the trajectory in Figure A.
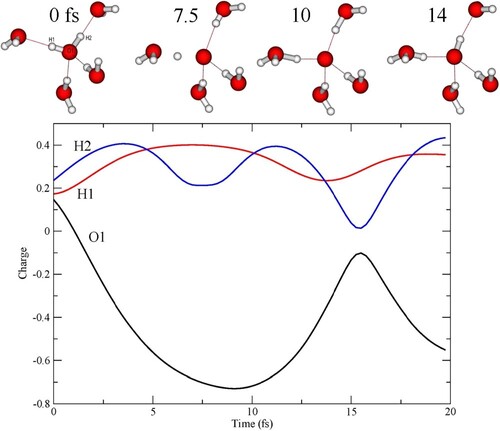
Figure 8. (A) XES spectra depending on OO distances for D2A2. Solid and dashed lines indicate SCKH and t = 0, respectively. (B) Time propagation of OH bonds for the core-excited oxygen averaged over all 60 trajectories. The dotted line connects the longest OH distances. Red and black distinguish the two hydrogens.
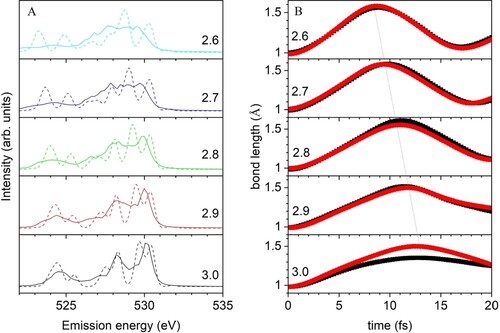
Figure 9. Comparison between sampling all nine modes (black) versus only the two stretch modes and the bending vibration (red) for (A) the D2A2 and (B) D1A1 species.
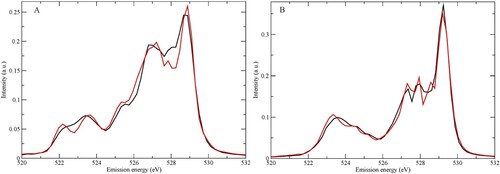
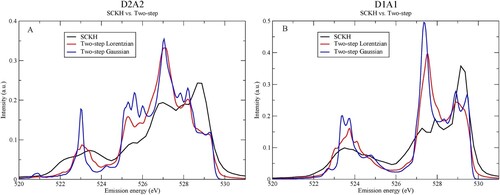
Figure 10. Comparison between the SCKH and two-step Lorentzian or Gaussian broadenings for (A) D2A2 and (B) D1A1 species.