
Figures & data
Figure 1. The top left panel shows the energy distribution of training data in three regions of the configuration space, as described in the text. Top right and bottom panels show the energy difference between the three PES considered in this work and ab initio calculations.
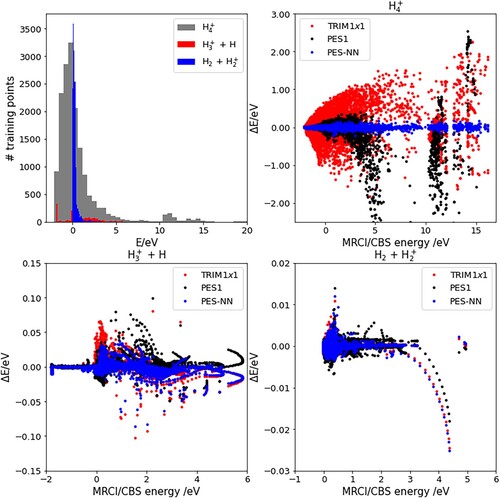
Table 1. Root mean squared errors of the ground electronic state for different energy regions, defined for .
Table 2. Root mean squared errors of the ground electronic state for different channels, calculated on all the geometries with energy lower than 17 eV.
Figure 2. +
approaches for several
and
angles and
Å (for
) and
Å (for
) the equilibrium distances of both species. The inset in the right hand side shows the coordinates used.
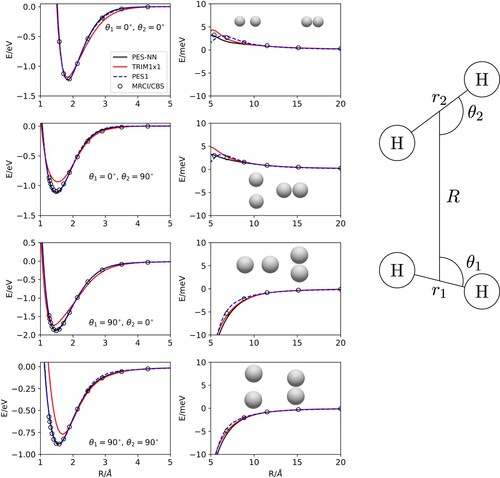
Figure 3. approaches, as a function of d, the distance of H to the
centre-of-mass. The orientations are preserved in the columns. The rows correspond to different equilateral
bond distances: top panels 0.85Å (equilibrium), middle panels to 0.7 Å and bottom panels to 0.6 Å, respectively. In the top panel, corresponding to
equilibrium configuration, the asymptotic energy is -1.816 eV.
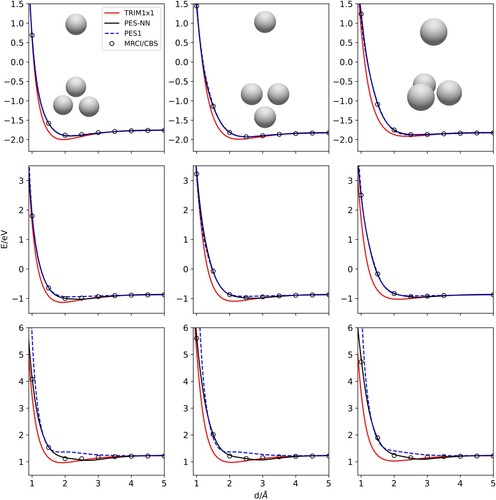
Figure 4. (v=0,j=0) +
(
,
=0)
reactive cross sections obtained with QCT calculations for different vibrational states
of
. The experimental results are those of Savic et al. [Citation65], from Glenewinkel-Meyer and D. Gerlich [Citation54] and Shao and Ng [Citation52], and the theoretical results of Eaker and Schatz [Citation55].
![Figure 4. H2(v=0,j=0) + H2+(v′,j′=0) → H3++H reactive cross sections obtained with QCT calculations for different vibrational states v′ of H2+. The experimental results are those of Savic et al. [Citation65], from Glenewinkel-Meyer and D. Gerlich [Citation54] and Shao and Ng [Citation52], and the theoretical results of Eaker and Schatz [Citation55].](/cms/asset/0bf3804f-152d-4966-b196-39c34d748d6a/tmph_a_2183071_f0004_oc.jpg)
Figure 5. H-hop and proton-hop cross sections (left panels) and maximum impact parameter, , (right panels) for the
(v=0,j=0) +
(
=0) reaction obtained with QCT calculations for different vibrational states
of
.
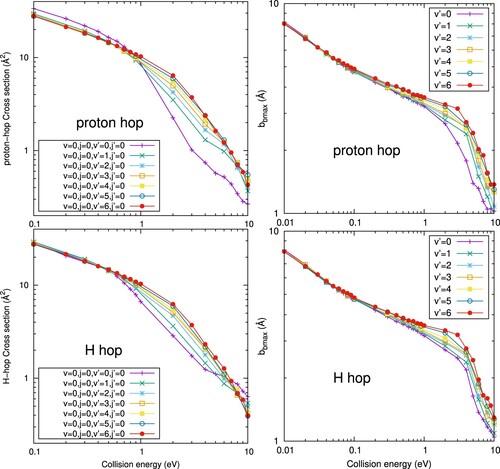
Figure 6. (a) D(v=0,j=0) + D
(
=0,
=0) reactive cross sections (blue line with open circles) compared with those for
(v=0,j=0) +
(
=0,
=0) (red line with open circles) obtained by QCT calculations. The cross section from Janev et. al. [Citation98] for
+
reaction is also displayed for comparison (black line with open circles). (b) The difference of each cross section relative to the present
+
cross section (open triangles on the coloured line).
![Figure 6. (a) D2(v=0,j=0) + D2+(v′=0, j′=0) reactive cross sections (blue line with open circles) compared with those for H2(v=0,j=0) + H2+(v′=0,j′=0) (red line with open circles) obtained by QCT calculations. The cross section from Janev et. al. [Citation98] for H2 + H2+ reaction is also displayed for comparison (black line with open circles). (b) The difference of each cross section relative to the present H2 + H2+ cross section (open triangles on the coloured line).](/cms/asset/155143ee-5edf-4d99-9de2-d4437da273d0/tmph_a_2183071_f0006_oc.jpg)
Figure 7. QCT (v=0,j=0) +
(
=6,
=0)
reactive cross sections obtained with the PESTRIM8×8 using surface hoping method (blue), the PESTRIM1×1 (red), the PES1 (black) and the new PES-NN (green) potential energy surfaces.
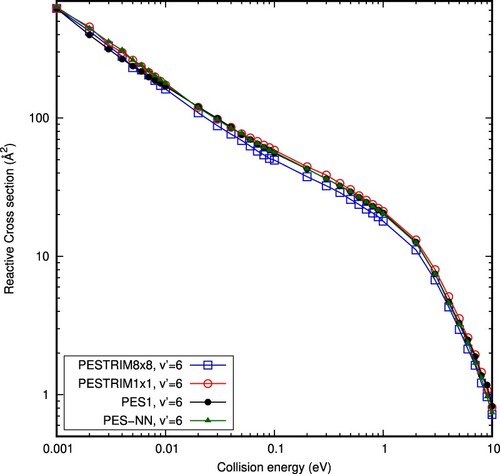
Figure 8. QCT v
j
+
v'
j'
+
(DF channel) reactive cross sections (left panel) and total cross section (formation of
and DF channel, in right panel) obtained with the PESTRIM8×8 using surface hoping method (blue), the PESTRIM1×1 (red) and the new PES-NN ( green) potential energy surfaces. The experimental results are those of Refs. [Citation54], [Citation62] and [Citation65] and.
![Figure 8. QCT H2(v=0,j=0) + H2+(v'=6,j'=0) → H2 + H++H (DF channel) reactive cross sections (left panel) and total cross section (formation of H3+ and DF channel, in right panel) obtained with the PESTRIM8×8 using surface hoping method (blue), the PESTRIM1×1 (red) and the new PES-NN ( green) potential energy surfaces. The experimental results are those of Refs. [Citation54], [Citation62] and [Citation65] and.](/cms/asset/316605fe-19d9-4746-8e08-1ffdf11177af/tmph_a_2183071_f0008_oc.jpg)
Figure 9. Two typical trajectories leading to double fragmentation (DF), as a function of the collision time in fs. Lower panels show the charge on each atom (Mulliken population) for the ground electronic state. Middle panels shows the energies of the four lower electronic states. Upper panels show some characteristic internuclear distances needed to characterise the trajectory. refers to the distance between atom
and
.
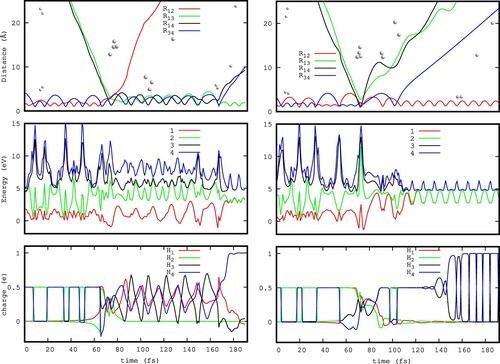
Figure 10. Vibrational, rotational and translational energy distributions of the products, as a function of the collision energy for the
+
collisions, for
=0 (left panel) and
=6 (right panel). The origin of energy is in the bottom of the well of the
products. The initial vibrational energies of the reactants is 0.413 and 1.673 eV for the
= 0 and 6, respectively, with respect to the minimum of each fragment. The potential energy difference between reactants and products is 1.816 eV, and when ZPE are accounted for, the exoergicity of the present PES becomes 1.688 eV.
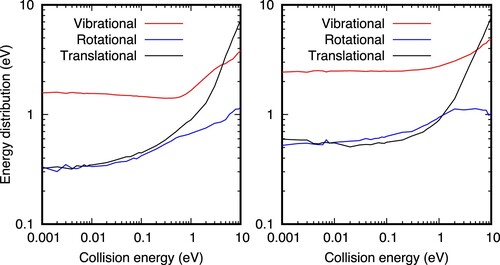
Figure 11. The population densities of D and H species by modelling using the different cross sections shown in Figure . In the inset, the labels of x-axis correspond to the cross sections used given by the upper number in the legends of the main graph.
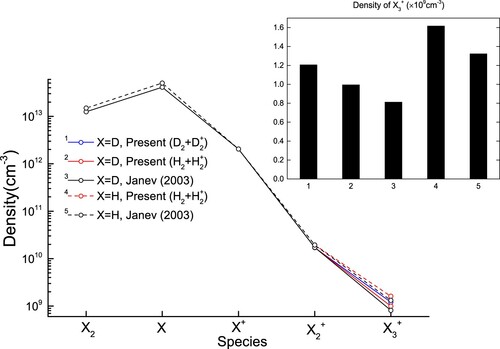
Table 3. Rate coefficients for D(v=0,j=0) + D
(
=0,
=0) reaction and the modelled density of D
depending on the cross sections shown in Figure 6(a).
Table B1. Collisional-radiative reactions and the rate coefficients considered in our plasma CRM.