Figures & data
Figure 1. (a) Ball-and-stick model of bi-isonicotinic acid with the primary OH··· N hydrogen-bonds shown as dotted lines. (Grey: C, white: H, red: O, blue: N); (b) Constant height qPlus AFM image acquired at 4.5 K (with a CO-functionalised tip) of rows of hydrogen-bonded bi-isonicotinic acid molecules on Au(111). Scale bar: 1 nm. Oscillation amplitude: 200 pm (± 20 pm). (c) Simulated AFM image using the Hapala et al. [Citation21] probe particle model.
![Figure 1. (a) Ball-and-stick model of bi-isonicotinic acid with the primary OH··· N hydrogen-bonds shown as dotted lines. (Grey: C, white: H, red: O, blue: N); (b) Constant height qPlus AFM image acquired at 4.5 K (with a CO-functionalised tip) of rows of hydrogen-bonded bi-isonicotinic acid molecules on Au(111). Scale bar: 1 nm. Oscillation amplitude: 200 pm (± 20 pm). (c) Simulated AFM image using the Hapala et al. [Citation21] probe particle model.](/cms/asset/740dc285-b7d4-42d0-bb53-650b0a6896b7/tmph_a_2192824_f0001_oc.jpg)
Figure 2. (a) 46 × 45 nm STM image of submonolayer domains of bi-isonicotinic acid on Au(111), deposited and imaged at room temperature. (Sample bias voltage: +1.5 V, tunnel current: 50 pA.) The majority of the image is taken up by molecular rows whose constituent molecules comprise either one or the other of the two enantiomers of the prochiral bi-isonicotinic acid. Inset: STM image (6 × 4.9 nm
) of bi-isonicotinic acid rows on Ag(100) showing the relative orientation of the enantiomers. (b) Schematic illustration of prochiral adsorption. The enantiomers are produced, in a 50:50 mixture, by adsorption of one of the ‘faces’ of the molecule onto the surface. When adsorbed, the molecule is locked into one enantiomeric form – without desorption and subsequent re-adsorption, a given enantiomer cannot switch state. (c) Modulus squared (i.e. power spectrum) of the two-dimensional Fourier transform of (a). The arrows highlight maxima arising from the interrow separation. (See text.) (d) Zoom of single-domain region of (a) highlighting variation in molecular orientation. The inset is the modulus squared of the corresponding 2D Fourier transform.
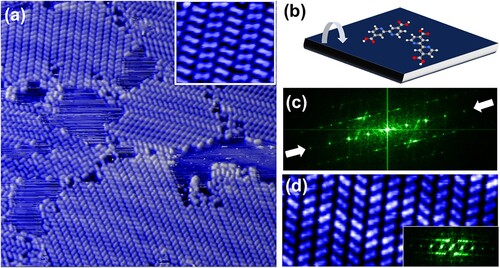
Figure 3. (a) nm
constant-height qPlus AFM image of neighbouring molecular rows comprising either one or the other of the two bi-isonicotinic acid enantiomers, acquired with a CO-functionalised tip. Inset: Constant-height dI/dV image of molecular rows acquired with a bias voltage of -1.17 V. As compared to the STM images shown in Figure (particularly the inset to Figure (a)), the dI/dV image shows a local contrast maximum, rather than a node, at the centre of the molecule. Note also the difference in brightness of that central maximum for different enantiomers. (b) Ball-and-stick model of the primary hydrogen bonds underpinning molecular organisation.
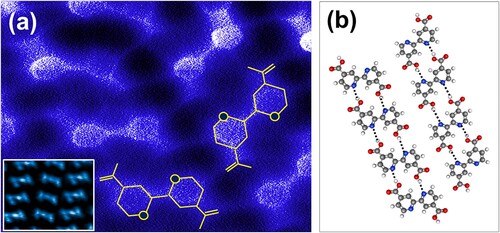
Figure 4. (a) nm
STM image of a far-from-equilibrium bi-isonicotinic acid assembly on Au(111), prepared via deposition onto a sample that had not equilibrated to room temperature. Note again the presence of contrast modulations in the molecular overlayer due to the underlying herringbone reconstruction, which is also clearly visible in the molecule-free regions of the surface. Image acquired at a sample bias of +3 V and tunnel current of 50 pA. (b) Offline zoom (
nm
) of a region of (a), highlighting absence of long-range order. (c) 2D Fourier transform (power spectrum) of (a) showing weak six-fold symmetry indicative of the influence of the surface potential on the molecular arrangement in this non-equilibrium case.
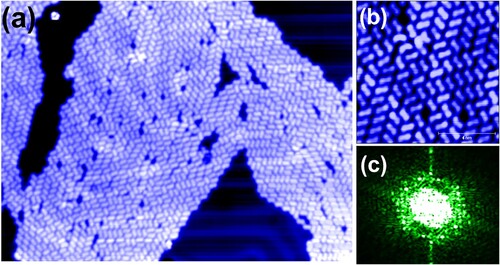
Figure 5. (a) Mapping of the bi-iosnicotinic acid molecule to a rhombus tile representation. In order to meet the constraints of the molecular lattices observed in experiment – in particular, the presence of two prochiral enantiomers and the staggered nature of the molecular rows – each molecular orientation is represented by three coupled rhombus tiles. Here we show only the orientations for one enantiomer. Another set of three rhombus tile blocks are required for the other enantiomer, resulting in a total of six sets of tile ‘triads’ to account for all possible orientations. Darker rhombus shading represents carboxyl groups, whereas the lighter-shaded central rhombus in each case represents the pyridinyl nitrogens. (b) Example of tile configuration for a OH··· N hydrogen bond between tiles of the same orientation. The OH··· N hydrogen bond is illustrated with a dotted red line.
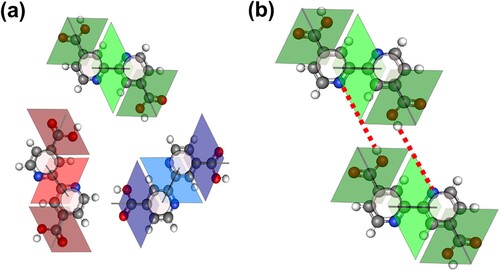
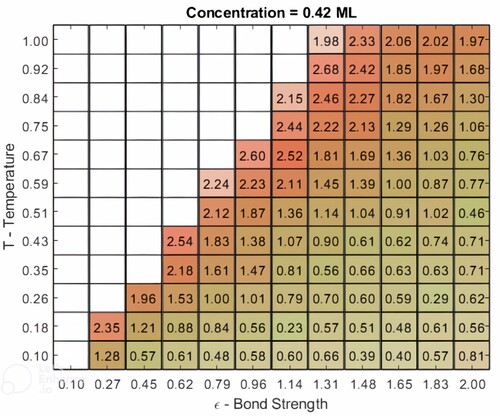
Figure 6. Output of Monte Carlo simulations at a fixed coverage (0.42 monolayer) and bond strength () for a range of effective temperatures. Each simulation was run for 10,000 Monte Carlo steps and the final arrangement of molecular tiles in each case is presented along with the associated normalised number of bonds per molecule, N. The molecular arrangements shown are individual results from simulations, whereas the values for N are a statistical average of final state lattices for one hundred Monte Carlo simulations at a given effective temperature.
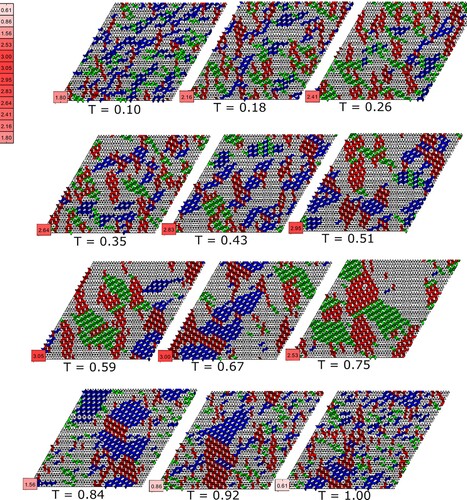
Figure 7. A map of the variation in the normalised bond number, N, and preference score, P, as a function of effective temperature and bond strength in the Monte Carlo simulations. The number in each grid entry is the value of N (averaged over 100 runs); the shading and colour are mapped to the preference score: a deeper red (green) represents a higher (lower) value of P, i.e. a larger proportion of OH··· N (OH··· O) bonds. Regions of the phase map associated with a disordered lattice gas are left blank, i.e. are numberless.