Figures & data
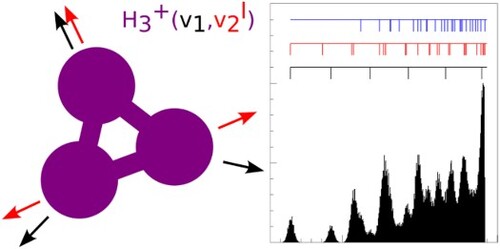
Figure 1. Energy level diagram of the rotationless vibrational levels of
. Pure symmetric vibrations are marked in black, pure asymmetric vibrations are marked in red, and combination bands are marked in blue. The energy values are taken from Ref. [Citation32]
![Figure 1. Energy level diagram of the rotationless vibrational levels (v1,v2l) of H3+. Pure symmetric vibrations are marked in black, pure asymmetric vibrations are marked in red, and combination bands are marked in blue. The energy values are taken from Ref. [Citation32]](/cms/asset/faa787ff-e670-4ac7-91ae-689dd6a6d505/tmph_a_2194455_f0001_oc.jpg)
Figure 2. Drawing of the new crossed-beam imaging spectrometer that is currently being built in our group. It shows a top down view of a horizontal slice through the setup. Two pulsed valves and skimmers are colored in red, the UV photoionization laser is sketched in purple. The ion and neutral beam paths are illustrated as green and red arrows. They intersect in the interaction region of a velocity map imaging spectrometer. The bottom part of the figure shows a heat map of applied voltages on the ion optics needed to produce a beam of 0.5 eV ions with minimised energy and angular spread. The optimisation has been performed and the heat map plot has been created with the COMSOL software package [Citation56].
![Figure 2. Drawing of the new crossed-beam imaging spectrometer that is currently being built in our group. It shows a top down view of a horizontal slice through the setup. Two pulsed valves and skimmers are colored in red, the UV photoionization laser is sketched in purple. The ion and neutral beam paths are illustrated as green and red arrows. They intersect in the interaction region of a velocity map imaging spectrometer. The bottom part of the figure shows a heat map of applied voltages on the ion optics needed to produce a beam of 0.5 eV H2+ ions with minimised energy and angular spread. The optimisation has been performed and the heat map plot has been created with the COMSOL software package [Citation56].](/cms/asset/d4fd8c7e-ede1-48d8-9c77-167c43e478e3/tmph_a_2194455_f0002_oc.jpg)
Figure 3. Histogram of the ion kinetic energy in the interaction region, simulated for a packet of ions moving through the potential energy landscape of the ion beamline. With optimised electrode voltages, a kinetic energy resolution of 18 meV (FWHM) is obtained.
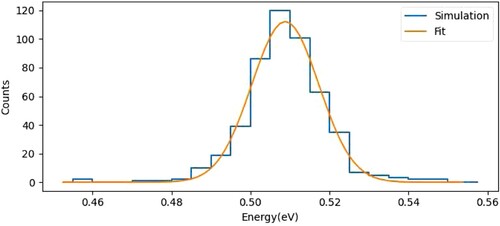
Figure 4. Newton diagram for reactive collisions of the title reaction in the laboratory frame of reference. The red and green arrows show the velocity vectors of the reactant beams used for the present simulation, the blue arrow shows the center of mass velocity. The black circle marks the kinematic cutoff velocity, the maximum product velocity for the given reactant velocities.
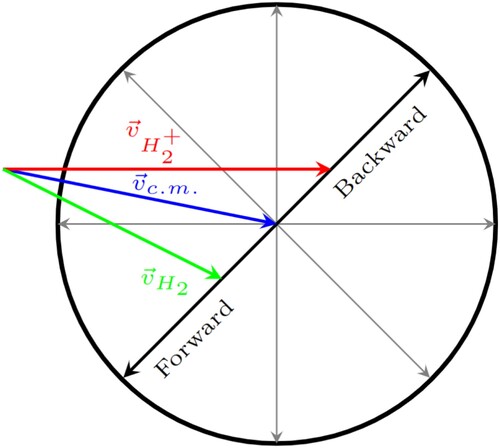
Figure 5. Diagram of the product velocities for the
+
reaction at 0.14 eV collision energy in the center of mass frame for all accessible
vibrational levels. The outermost circle represents the kinematic cutoff with no internal excitation in the
product. The circles with dashed lines show the pure symmetric vibrational levels, the circles with continuous lines show the pure asymmetric vibrational levels, and the circles with dotted lines show the combination vibrations. Superimposed are several ellipses denoting the radial and angular product velocity resolution for selected velocities and scattering angles (a) for the running velocity map imaging spectrometer [Citation55] and (b) for the currently constructed spectrometer. The ellipses are calculated with Gaussian error propagation based on the expected resolution of the reactant beams. Note that the ellipses for the new apparatus are so small that they become barely visible.
![Figure 5. Diagram of the H3+ product velocities for the H2+ + H2 reaction at 0.14 eV collision energy in the center of mass frame for all accessible H3+ vibrational levels. The outermost circle represents the kinematic cutoff with no internal excitation in the H3+ product. The circles with dashed lines show the pure symmetric vibrational levels, the circles with continuous lines show the pure asymmetric vibrational levels, and the circles with dotted lines show the combination vibrations. Superimposed are several ellipses denoting the radial and angular product velocity resolution for selected velocities and scattering angles (a) for the running velocity map imaging spectrometer [Citation55] and (b) for the currently constructed spectrometer. The ellipses are calculated with Gaussian error propagation based on the expected resolution of the reactant beams. Note that the ellipses for the new apparatus are so small that they become barely visible.](/cms/asset/16093524-2302-41a7-bf57-098caa3a4e24/tmph_a_2194455_f0005_oc.jpg)
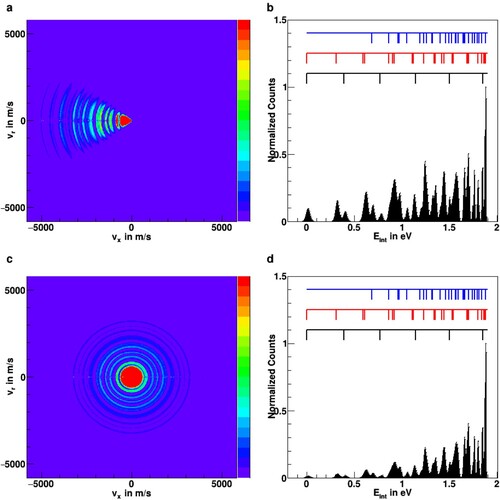
Figure 6. Monte Carlo simulations of ion scattering images after reaction at a collision energy of 0.14 eV for two different types of assumed reaction mechanisms, (a) forward scattering with reduced probability for high internal excitation and (c) isotropic scattering with statistical partitioning into all available vibrational levels (see text for details). Panels (b) and (d) show the respective internal energy distributions after integration over the scattering angle. The positions of vibrational levels are represented by the black (symmetric vibrations), red (asymmetric vibrations), and blue (combination vibrations) markers (see also Figure ).