Figures & data
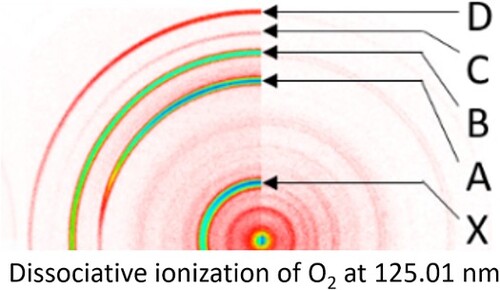
Figure 1. Absorption spectra of O2 in photon energy range of (a) 10 eV region adapted from Ref. [Citation8] at 10 eV and the total O+ yield spectrum (black line) around (b) 20 eV from Ref. [Citation9], where the red line marked (*) is O+ paired with low energy (<1 eV) electrons. Positions of the n, v states of the (B2Σg-) n(v)pσu Rydberg series are labelled in panel (b) Absolute cross sections are shown for the 10 eV range; absorption cross sections for the 20 and 30 eV (not shown) range can be estimated from Ref. [Citation10]. In the 30 eV region the absorption spectrum is constant with a cross section of ∼2 × 10⁻¹⁷ cm2. The FEL was set at the energy positions of the vertical dashed lines, corresponding to 127.96, 126.0, 125.01, 123.76, and 122.01 nm in the 10 eV spectrum. Other details shown in the figure are explained later in the text.
![Figure 1. Absorption spectra of O2 in photon energy range of (a) 10 eV region adapted from Ref. [Citation8] at 10 eV and the total O+ yield spectrum (black line) around (b) 20 eV from Ref. [Citation9], where the red line marked (*) is O+ paired with low energy (<1 eV) electrons. Positions of the n, v states of the (B2Σg-) n(v)pσu Rydberg series are labelled in panel (b) Absolute cross sections are shown for the 10 eV range; absorption cross sections for the 20 and 30 eV (not shown) range can be estimated from Ref. [Citation10]. In the 30 eV region the absorption spectrum is constant with a cross section of ∼2 × 10⁻¹⁷ cm2. The FEL was set at the energy positions of the vertical dashed lines, corresponding to 127.96, 126.0, 125.01, 123.76, and 122.01 nm in the 10 eV spectrum. Other details shown in the figure are explained later in the text.](/cms/asset/7a054ec6-9a29-4f22-965a-d086e9b31090/tmph_a_2195506_f0001_oc.jpg)
Figure 2. Schematic potential energy curves for the electronic states of O2 (black lines) and O2+ (graylines) most relevant to this study. The separated-atoms or dissociation limits are labelled in increasing energy and indicated by horizontal lines as neutral dissociation limits (NDL) for O2 and ionic dissociation limits (IDL) for O2+ (Table ). Dissociation limits correlating with O(3P) products are indicated by gray horizontal lines. EA represents the lowest energy position for production of neutral excited atoms.
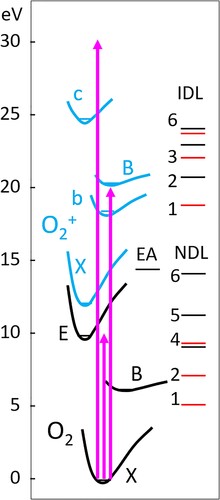
Table 1. Dissociation limits of O2+ and their correlating molecular states.
Figure 3. Raw O+ images from FEL-only (right side) and FEL + O(3P2) REMPI (left side) crossing an O2 molecular beam. Intensity is shown on a log scale to bring out the weaker rings, a colour coding bar for linear colour scale images is shown in Figure . For both lasers linear polarisation is used with the E field direction along the vertical axis of the figure. The more intense rings seen with VUV+REMPI are labelled (D–X) in the 125.01 nm image.
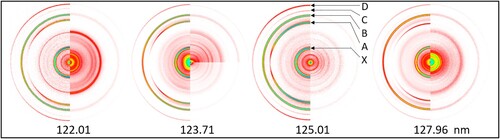
Table 2. Assignments of main peaks in the FEL + REMPI images.
Figure 4. Total kinetic energy release (TKER) distributions for the O+ images shown in Figure , using the FINA inversion program. The upper (gray) curves are from FEL + REMPI images while the lower (dark gray curves) are from FEL only images. Peaks seen in the FEL + REMPI curves are also indicated in Fig and assigned in more detail in Figure . Several peaks labelled with (*) are from excited atom (EA) pathways. Symbols connected to vertical drops lines for the FEL only curves and drop-down vertical lines in the FEL + REMPI curves are explained in the text and following figures. [See colour online].
![Figure 4. Total kinetic energy release (TKER) distributions for the O+ images shown in Figure 3, using the FINA inversion program. The upper (gray) curves are from FEL + REMPI images while the lower (dark gray curves) are from FEL only images. Peaks seen in the FEL + REMPI curves are also indicated in Fig 3 and assigned in more detail in Figure 6. Several peaks labelled with (*) are from excited atom (EA) pathways. Symbols connected to vertical drops lines for the FEL only curves and drop-down vertical lines in the FEL + REMPI curves are explained in the text and following figures. [See colour online].](/cms/asset/b4fe5d69-fd76-43be-82e6-2dab402360bf/tmph_a_2195506_f0004_oc.jpg)
Figure 5. Low energy region of the raw FEL-only image and TKER curve at 125.01 nm using a linear colour scale. The symbols on the vertical striped lines represent dissociation of the B-state (open squares) and b-state (filled circles). Peaks marked by and asterisk (*) indicate possible excited atom (EA) states with a perpendicular angular distribution.
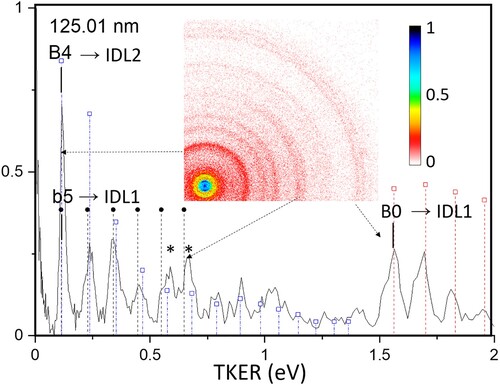
Figure 6. Detailed FEL-only TKER curve and partial image (log intensity) at 123.71 nm.
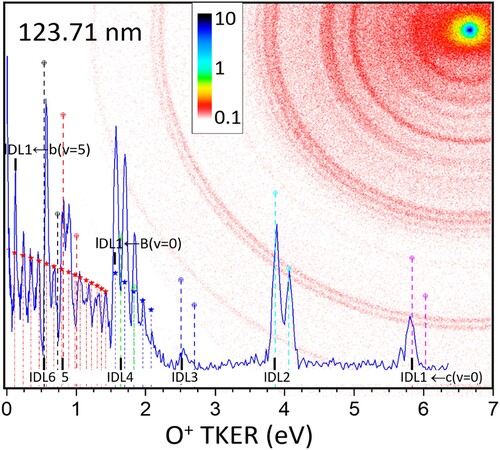
Figure 7. Schematic potential energy curves relevant to this work showing O2+ bound states and one of their Rydberg progressions, adapted from Ref. [Citation27]. Curves corresponding to the c-state, which correlates with IDL2 and its precursor Rydberg states are colour coded in black, similar grouping are shown for the 32Πu states (IDL5 – blue) and the B-states (IDL3 – green). Resonances in the absorption spectrum corresponding to transitions to the B-states group are labelled in the 20 eV graph in Figure . [See colour online].
![Figure 7. Schematic potential energy curves relevant to this work showing O2+ bound states and one of their Rydberg progressions, adapted from Ref. [Citation27]. Curves corresponding to the c-state, which correlates with IDL2 and its precursor Rydberg states are colour coded in black, similar grouping are shown for the 32Πu states (IDL5 – blue) and the B-states (IDL3 – green). Resonances in the absorption spectrum corresponding to transitions to the B-states group are labelled in the 20 eV graph in Figure 1. [See colour online].](/cms/asset/c5125277-ca91-4593-a5b3-7b71c52642d8/tmph_a_2195506_f0007_oc.jpg)
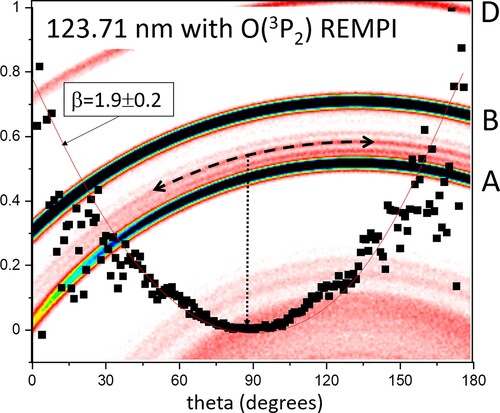
Figure 8. Expanded portion of the 123.71 nm FEL +O(3P2) – REMPI laser image with one of the rings corresponding to photodissociation of the O2+ b(v = 2) state (see Figure ) indicated by a dashed line. The angular distribution of this ring is superimposed above the image along with its best-fit angular distribution parameter curve for β = 1.9 ± 0.2 (see text).