
Figures & data
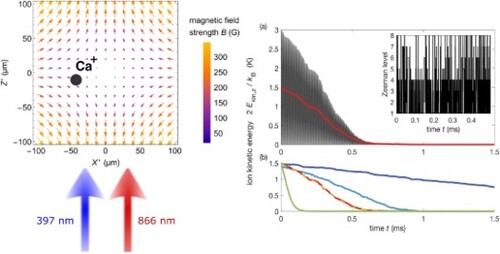
Figure 1. (a) Energy level structure relevant for the Doppler laser cooling of . The field-free fine-structure levels are indicated by dotted lines with transition wavelengths
and decay rate constants
(
for cooling/repumper) according to reference [Citation39]. In a B-field, these levels split into an eight-level system. Throughout this manuscript, the Zeeman sublevels are numbered from 1 to 8 as indicated in the figure. (b,c) Frequencies of σ- and π-transitions between Zeeman components (indicated by their magnetic quantum numbers
) of the cooling (b) and repumper (c) transitions as a function of the axial (z) position of the ion in the hybrid trap.
![Figure 1. (a) Energy level structure relevant for the Doppler laser cooling of 40Ca+. The field-free fine-structure levels are indicated by dotted lines with transition wavelengths λt and decay rate constants Γt (t=c/r for cooling/repumper) according to reference [Citation39]. In a B-field, these levels split into an eight-level system. Throughout this manuscript, the Zeeman sublevels are numbered from 1 to 8 as indicated in the figure. (b,c) Frequencies of σ- and π-transitions between Zeeman components (indicated by their magnetic quantum numbers mJ) of the cooling (b) and repumper (c) transitions as a function of the axial (z) position of the ion in the hybrid trap.](/cms/asset/62edf6a7-2799-4c02-86e5-46247188f05e/tmph_a_2199099_f0001_oc.jpg)
Figure 2. The sum of the populations of the two Zeeman sublevels
and
according to our stochastic model (black) based on eight-level rate-equations. The inset shows the result of the stochastic model for a single simulation run. The ensemble average over multiple repetitions (here 200 times in the black trace) approaches the continuous solutions of the rate equations (red trace). Two counter-propagating cooling and two counter-propagating repumper lasers with saturation parameters
, detunings
,
and left circular polarisation with respect to the laser propagation direction at a B-field of
were assumed.
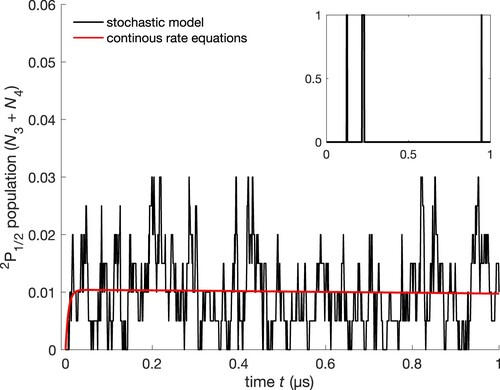
Figure 3. Fourier spectra of the motion of an ion trapped in a linear Paul trap (a) in the absence of a B-field and (b) & (c) with an overlapped quadrupolar magnetic field. The dominant features correspond to the frequencies of the secular motion (101, 203.5 kHz), the micromotion (8 MHz), and its second harmonic (16 MHz). In the inhomogeneous B-field, the motions along different axes mix with each other and produce peaks in the Fourier spectrum at sum and difference frequencies.
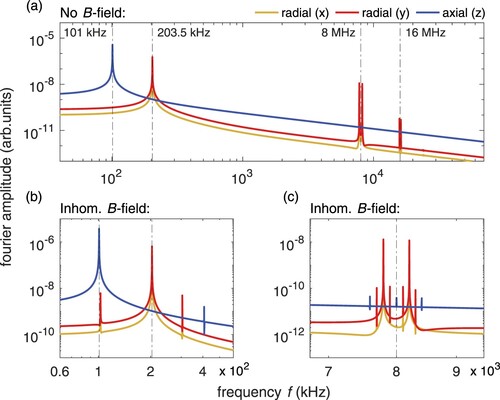
Figure 4. (a) Example of the time evolution of the kinetic energy of an ion along the axial direction (black trace) and its average over one period of the secular motion (red trace). The inset shows the population of the eight Zeeman sublevels over the course of the ion trajectory for the first 0.5 ms (see Figure for labelling of the levels). (b) Averaged ion kinetic energies for different experimental configurations. Green trace: without magnetic field; red trace: cooling and the repumper lasers with linear polarisation and aligned with the x axis (same situation as in panel (a)); yellow-dotted trace: linear polarisation aligned in the direction; violet trace: left circular polarisation; blue trace: left circular polarisation for an initial velocity vector with higher radial components ([4.80, -4.21, 24.11] m/s compared to [0.68, -0.89, -24.92] m/s used in the other simulations). Laser detunings:
,
.
![Figure 4. (a) Example of the time evolution of the kinetic energy of an ion along the axial direction (black trace) and its average over one period of the secular motion (red trace). The inset shows the population of the eight Zeeman sublevels over the course of the ion trajectory for the first 0.5 ms (see Figure 1 for labelling of the levels). (b) Averaged ion kinetic energies for different experimental configurations. Green trace: without magnetic field; red trace: cooling and the repumper lasers with linear polarisation and aligned with the x axis (same situation as in panel (a)); yellow-dotted trace: linear polarisation aligned in the x^+y^ direction; violet trace: left circular polarisation; blue trace: left circular polarisation for an initial velocity vector with higher radial components ([4.80, -4.21, 24.11] m/s compared to [0.68, -0.89, -24.92] m/s used in the other simulations). Laser detunings: δc=−30MHz, δr=−10MHz.](/cms/asset/9ba3010f-89f8-45c7-a0e9-4e899056b83a/tmph_a_2199099_f0004_oc.jpg)
Figure 5. Ion kinetic energy half-lives (time required to remove half of the ion's kinetic energy) at different cooling-laser (
) and repumper detunings (
) for a single ion in the hybrid trap. Doppler cooling requires a red-detuned cooling laser beam (
). The shortest cooling half-lives are found between
and
and for repumper laser detunings in a range of more than a hundred MHz around the repumper transition resonance.
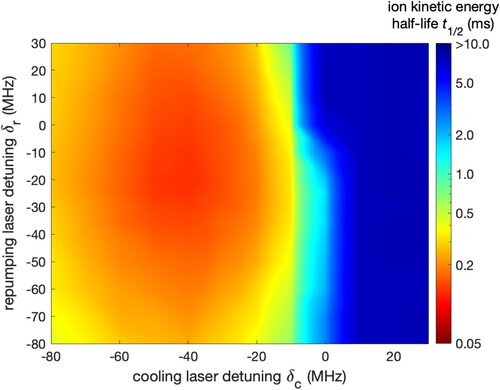
Figure 6. Locations in the lab frame at which absorption events of photons occurred along a representative ion trajectory. Absorption events happen across the whole ion trajectory. Events with an anti-parallel projection of the ion's velocity vector onto the laser propagation direction (red) occur significantly more often than absorption events with a parallel projection (black). The initial velocity vector of the ion was [0.68, -0.89, -24.92] m/s.
![Figure 6. Locations in the lab frame at which absorption events of 397nm photons occurred along a representative ion trajectory. Absorption events happen across the whole ion trajectory. Events with an anti-parallel projection of the ion's velocity vector onto the laser propagation direction (red) occur significantly more often than absorption events with a parallel projection (black). The initial velocity vector of the ion was [0.68, -0.89, -24.92] m/s.](/cms/asset/fbf1a24b-cff2-47a6-91c1-6db9c62c470a/tmph_a_2199099_f0006_oc.jpg)
Figure 7. Dependency of the energy half-life on the linewidth of the cooling laser and of the repumper laser
for different laser power spectral densities. The linewidth of the (a) cooling and (b) repumper laser remained fixed while the (a) repumper and (b) cooling laser linewidth was varied. For each specific linewidth, the saturation parameter was chosen to produce the quoted laser power spectral densities. A decrease of the half-life with increasing linewidth is only observable for low power densities indicating that power broadening is sufficient to cover the required spectral width for efficient laser cooling. Detunings of
and
were assumed for the fixed-frequency lasers.
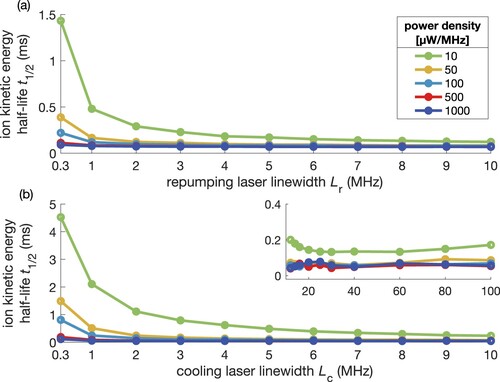
Figure 8. Effect of a misalignment between the RF and magnetic traps. An increase in distance between the two trap centres along the positive axial direction results in an increase in the energy half-life for laser parameters that were found for optimal cooling in the case of a perfect overlap of the traps. The inset shows the population of the eight Zeeman sublevels over the course of an ion trajectory at an offset of (see Figure for labelling of the levels). Compared to the ideal case shown in Figure (a), much fewer absorption events occur. The initial velocity vector of the ion was [0.68, -0.89, -24.92] m/s.
![Figure 8. Effect of a misalignment between the RF and magnetic traps. An increase in distance between the two trap centres along the positive axial direction results in an increase in the energy half-life for laser parameters that were found for optimal cooling in the case of a perfect overlap of the traps. The inset shows the population of the eight Zeeman sublevels over the course of an ion trajectory at an offset of 80μm (see Figure 1 for labelling of the levels). Compared to the ideal case shown in Figure 4 (a), much fewer absorption events occur. The initial velocity vector of the ion was [0.68, -0.89, -24.92] m/s.](/cms/asset/53b608bb-0129-4bb1-bd5d-c3b113e704af/tmph_a_2199099_f0008_ob.jpg)
Figure 9. Ion kinetic energy half-lives (in ms) for different detunings of two co-propagating cooling lasers at a relative trap displacement of
along the axial direction. Efficient laser cooling at such a trap displacement can be recovered by setting the detunings of the two lasers such that they deplete the two
Zeeman sublevels. The role of the two lasers is interchangeable, leading to two areas of efficient laser cooling. Only the cooling transition
was considered in this figure.
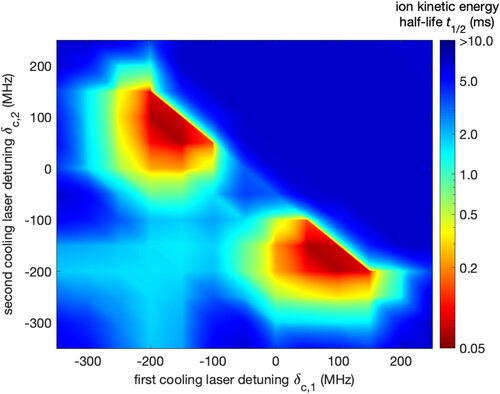
Figure 10. Kinetic energy along the axial direction of the ion motion (black trace) at a trap offset of for two co-propagating cooling lasers and a single repumper laser. The red trace depicts the average over the secular motion. The detunings of the two cooling lasers were
and
. The repumper laser exhibited a detuning of
and linear polarisation aligned with the x axis. No cooling occurs if the repumper laser has circular polarisation which is shown by the averaged kinetic energy for left circular polarisation (red-dashed trace).
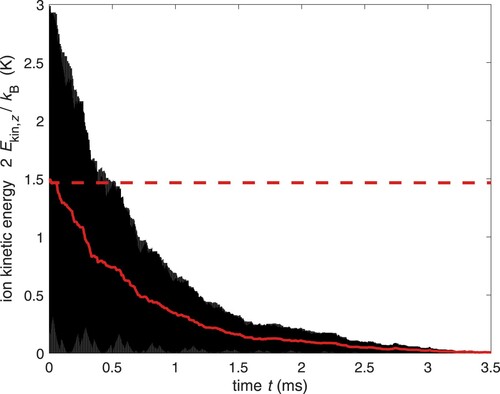
Figure 11. Trajectory of an ion in the hybrid trap (a) & (b) over the course of and (c) & (d) over
for (a) & (c) a perfect overlap between the ion and magnetic traps and for (b) & (d) a displacement of
along the positive axial direction between the trap centres of the ion and magnetic trap. While the oscillatory motion of the ion in the radial plain remains in the direction of the initial velocity vector over the course of hundreds of microseconds in a perfectly overlapped hybrid trap, the trajectory in the presence of a trap centre displacement shows signatures of cyclotron motion reminiscent of Penning traps. The initial velocity vector of the ion was [14.63, 15.18, 13.33] m/s.
![Figure 11. Trajectory of an ion in the hybrid trap (a) & (b) over the course of 100μs and (c) & (d) over 400μs for (a) & (c) a perfect overlap between the ion and magnetic traps and for (b) & (d) a displacement of 80μm along the positive axial direction between the trap centres of the ion and magnetic trap. While the oscillatory motion of the ion in the radial plain remains in the direction of the initial velocity vector over the course of hundreds of microseconds in a perfectly overlapped hybrid trap, the trajectory in the presence of a trap centre displacement shows signatures of cyclotron motion reminiscent of Penning traps. The initial velocity vector of the ion was [14.63, 15.18, 13.33] m/s.](/cms/asset/d6ab3f7a-54aa-4c20-8836-e475f1f94c88/tmph_a_2199099_f0011_ob.jpg)
Supplemental Material
Download PDF (1.1 MB)Data availability statement
The codes used to produce the findings of this study are available on the Zenodo repository with the identifier doi:10.5281/zenodo.7445811.