
Figures & data
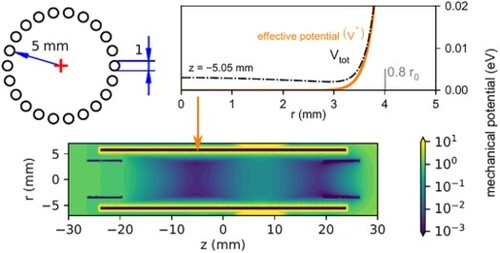
Figure 1. Panel (a): Schematic view of the setup. SIS – Storage Ion Source, 1.QP – source quadrupole, B. – electrostatic bender, 22 pt – 22 pole trap, 2. QP – product quadrupole, K. -- Daly Knob (conversion dynode), CEM – channel electron multiplier. Panel (b): 3D model of the 22 pole trap. Panel (c): effective mechanical potential inside the trap for a singly charged particle of mass ,
,
,
,
,
, the rest of the ring electrodes are at 0 V.
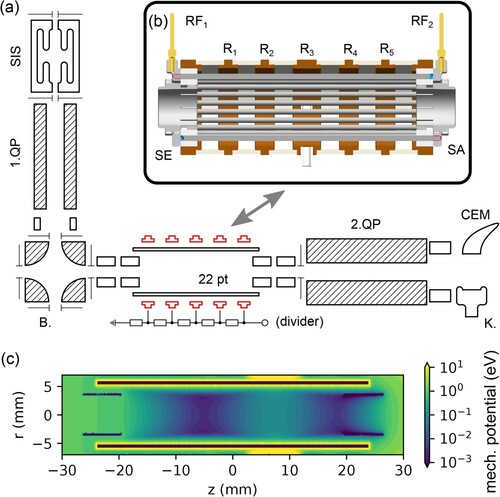
Figure 2. Radial profile of different potentials in the trap. In red and blue, potential generated by the ring electrode at different z positions along the axis of the trap, towards the centre of the rod (red) and towards the middle of the gap between rods (blue); cf. top left inset. Cyan line for
represents the overlap of blue and red lines. Black dashed-dotted line: effective potential at
for the trap configuration described in Figure . Arrow marks the minimum of the total potential at
. Solid orange lines: analytical expressions for the effective potential and adiabaticity parameter for the corresponding ideal multipole. Dashed orange lines: calculated adiabaticity parameter towards the centre of the rod and the middle of the gap between the rods (shown only for
).
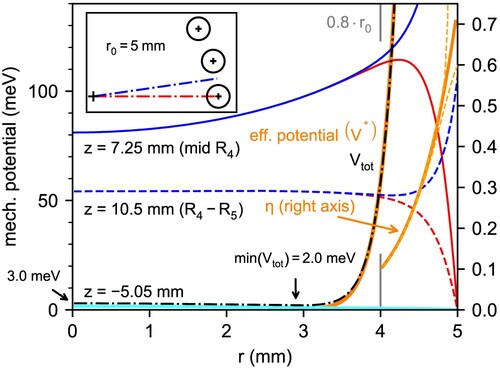
Figure 3. Panel (a): Axial profile of the electrostatic potentials generated by the two ring electrodes closest to the trap exit, and
, when set to 100 V, and the output electrode SA set to 1 V (see Figure ). Panel (b): Axial profile of the relative electrostatic potentials generated by the
ring electrode with respect to the applied voltage, when the output electrode is set to an extraction voltage of
.
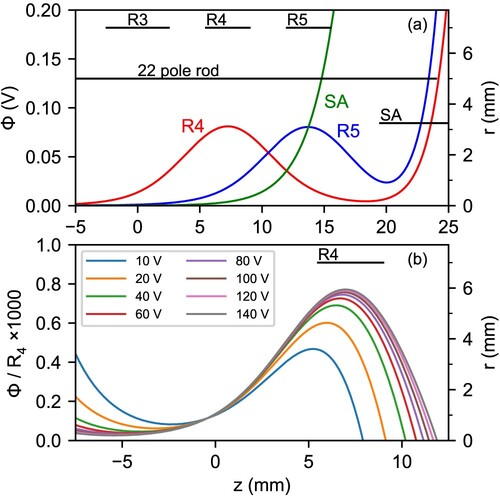
Figure 4. Trapping and emptying of the trap equipped with ring electrodes. Top panel: axial profile of electrostatic potential produced by the electrodes. Red colour represents trapping potential, dark blue colour represents emptying potential with no ring electrodes. The use of ring electrodes and the divider (see Figure ) creates a uniform decreasing potential (light blue). Bottom panel: Effect of the divider on the extraction of mass ions from the trap held at
.
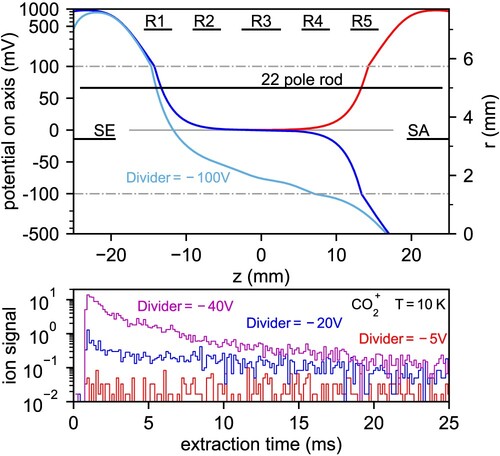
Figure 5. Evaporation of from the trap over
electrode as a function of electrode potential, number density and neutral gas. Inset (a): evaporation (escape rate r) from the 22 pole trap as seen with the MCS. Panel (b): escape rate r as a function of neutral number density for
,
gas (gray arrow marks the point corresponding to inset (a)). Panel (c): Apparent collisional rate
as a function of the potential on the
electrode.
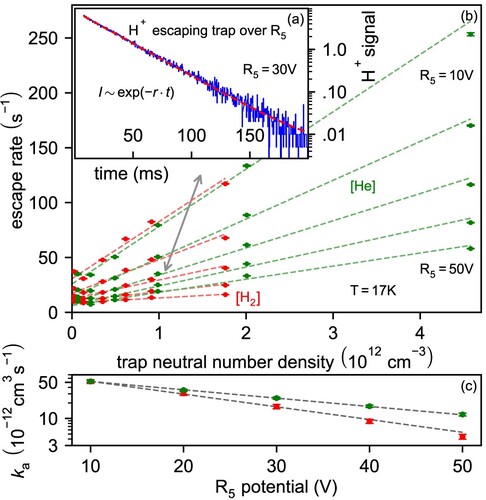
Figure 6. Reaction rate of as a function of
pressure at trap temperatures of 26 and
. Inset: Number of ions in the trap as a function of storage time. Loss rate in absence of reactants is negligible at time scales of hundreds of ms. Grey arrow points to the data point, which is represented by the inset. N, T – normal LS, total LS respectively (see text).
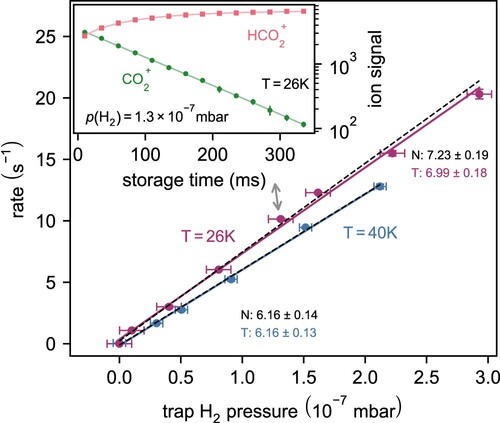
Figure 7. Reaction rate coefficient of and
with
and
as a function of temperature. Langevin rate coefficient shown on the left (dash; L.). Previous results are reported using open symbols and dashed lines (
[Citation43,Citation65,Citation66] and
[Citation65,Citation67]).
![Figure 7. Reaction rate coefficient of CO+ and CO2+ with H2 and D2 as a function of temperature. Langevin rate coefficient shown on the left (dash; L.). Previous results are reported using open symbols and dashed lines (CO+ [Citation43,Citation65,Citation66] and CO2+ [Citation65,Citation67]).](/cms/asset/4cb4b129-4fe1-462d-9d22-adf14809f253/tmph_a_2217744_f0007_oc.jpg)
Figure 8. Electronic spectrum of cation Meinel system [Citation71] (gray line – band origins) recorded using VIS-LICT (laser induced charge transfer) scheme [Citation68]. In red, measurements performed at 150 K. In magenta, at 90 K.
![Figure 8. Electronic spectrum of N2+ cation Meinel system [Citation71] (gray line – band origins) recorded using VIS-LICT (laser induced charge transfer) scheme [Citation68]. In red, measurements performed at 150 K. In magenta, at 90 K.](/cms/asset/3aed86e5-33f9-40e2-bab7-82924135c16b/tmph_a_2217744_f0008_oc.jpg)