
Figures & data
Figure 1. (a) Illustration of information consistent behavior for the proposed Bayes factor when the observed effect e increases. (b) Illustration of the effect of different fractions across groups when the sample in group 1 is fixed at and the sample in group 2 increases. (c) Illustration of the difference between the adjusted prior mean and the unadjusted (OLS) prior mean. (d) Illustration of the change in evidence when increasing the number of random missing observations using list-wise deletion and sampling missings from the posterior predictive distribution.
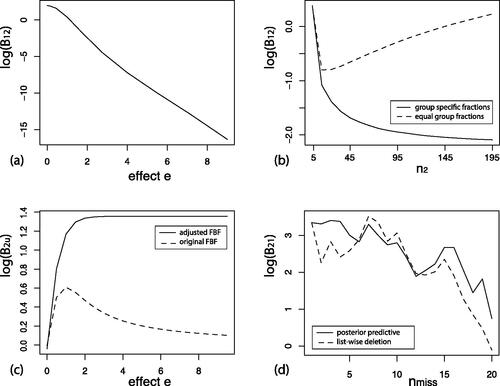
Table 1. Unconstrained estimates and properties of the rats data with levels of enzyme type SDH (y1), enzyme type SGOT (y2), and enzyme type SGPT (y3). Note. SDH = sorbitol dehydrogenase. SGOT = serum glutamic oxaloacetic transaminase. SGPT = serum gtutamic-pyruvic transaminase.
Table 2. Bayesian model selection for the rats application. In the second, third, fourth, fifth, sixth and seventh column, the relative measures of fit of the equality constraints, complexity of the equality constraints, fit of the order constraints, complexity of the order constraints, the Bayes factors against an unconstrained alternative (EquationEquation (7)(7)
(7) ), and the posterior probability are presented, respectively.
Table 3. Unconstrained estimates for the Sesame Street application.
Table 4. Bayesian Hypothesis Evaluation for the Sesame Street application. In the second, third, fourth, fifth, sixth and seventh column, the relative measures of fit of the equality constraints, complexity of the equality constraints, fit of the order constraints, complexity of the order constraints, the Bayes factors against an unconstrained alternative (EquationEquation (7)(7)
(7) ), and the posterior probability are presented, respectively.