
Figures & data
Table 2. Distribution of z-scores derived from the best selected models from each distribution family, in boys (n = 3,321) and girls (n = 3,081).
Table 1. Information criteria for the development of the GAMLSS models for total PRC score in boys (n = 3,321) and girls (n = 3,081), with separate predictors for median mu variability sigma
skewness lamdba
and kurtosis tau
Figure 1. Q-Q plot of the normalized residuals (z-scores), derived from modeling PRC against age using three distribution families in (A) boys (n = 3,321; top panel) and (B) girls (n = 3,081; bottom panel).
Legend: the shaded area from -2 to +2 z-scores represents the range that z-scores derived from each distribution are similar.
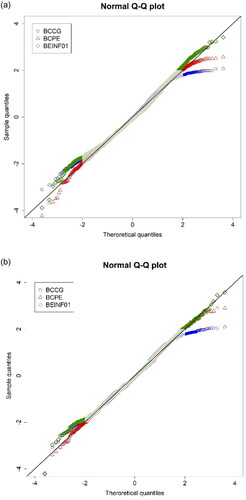
Figure 2. Density distributions of the total PRC score (upper left) and the fitted BCPE (lower left) and BEINF01 (lower right) distributions, using the fitted parameters of the best-selected models (BCPE, M2.6: mu = 90.22, sigma = 0.3711, lambda = 1.0512, tau = 5.3556 at the 0–158 range; BEINF01, M3.3: mu = 0.5664, sigma = 0.4284, lambda = 8.9e-09, tau = 0.0006 at the 0–1 range), in boys (n = 3,321).
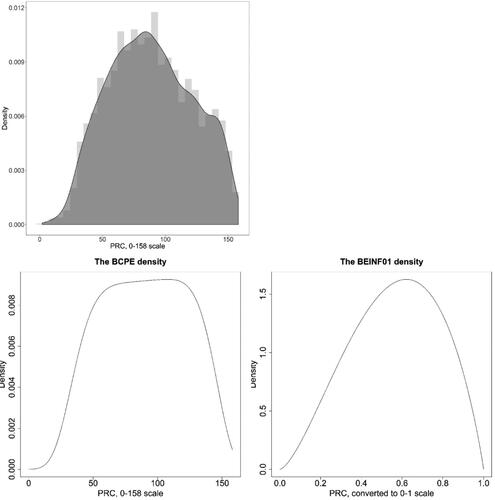
Figure 3. Density distributions of the total PRC score (upper left) and the fitted BCPE (lower left) and BEINF01 (lower right) distributions, using the fitted parameters of the best-selected models (BCPE, M2.8: mu = 108.4, sigma = 0.2774, nu = 1.733, tau = 10.50 at the 0–158 range; BEINF01, M3.1: mu = 0.6606, sigma = 0.4261, lambda = 3.3e-09, tau = 0.0033 at the 0–1 range), in girls (n = 3,081).
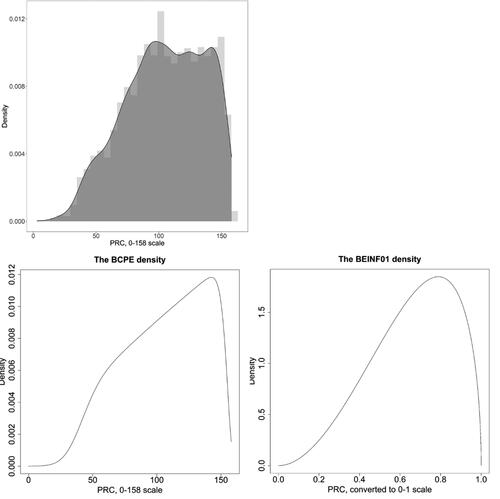
Figure 4. Trends between the standardized and PRC scores for each distribution family over age for (A) boys (n = 3,321; upper panel), and (B) girls (n = 3,081; lower panel).
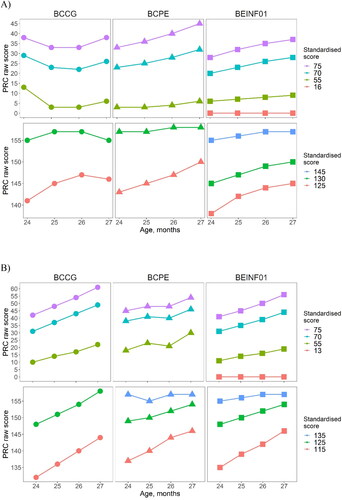
Table 3. Predicted vs raw PRC scores, by age group, using the best selected model from each distribution family, in boys (n = 3,321) and girls (n = 3,081).
Supplemental Material
Download MS Word (3.4 MB)Data availability statement
Data sharing is not applicable as secondary data were analyzed in this study, hence no new data were created in this study. The code used to analyze the current data is available as an Appendix in the online supplementary material. The parameters obtained from the equations derived from the mixed distributions are also freely available on the PARCA-R website (www.parca-r.info) to facilitate its use in research and clinical practice.