
Figures & data
Figure 1. Example of Cattel’s databox, showing how data can be thought to come from three different dimensions: variables (here only two), persons, and occasions. It further shows that a cross-section of two variables consists of many individuals at one occasion, whereas a person-specific (N = 1) study consists of many occasions from a single person.
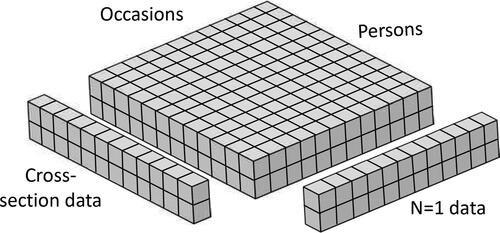
Table 1. Five correlations that can be used to describe the way X and Y are related.
Figure 2. Illustration of how the average person-specific correlation κ (dashed line) falls in between the person-specific correlations that characterize the two subpopulations (i.e., κp, represented by the two solid lines), and how the within-person correlation ρW from the expression for the cross-sectional correlation (dotted line) deviates from this, depending on the person-specific variances. in the second subpopulation is varied by varying the person-specific variances of X and Y, while all else (i.e., person-specific covariance in second subpopulation, and person-specific variances and covariance in first subpopulation) are held constant.
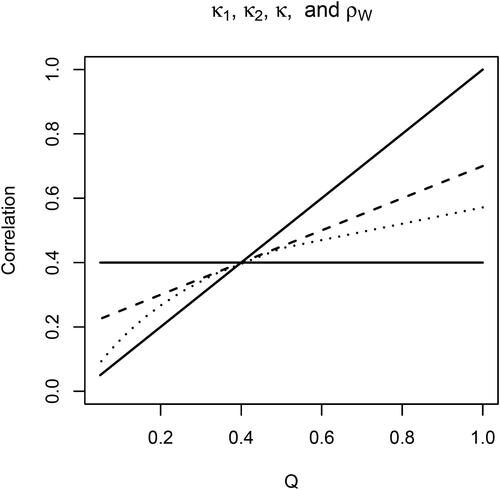
Figure 3. Heatmap showing the sum of the two weights (i.e., as a function of the intraclass correlation (i.e., proportion of BP variance) in X (i.e.,
) and Y (i.e.,
). Lighter colors indicate higher values.
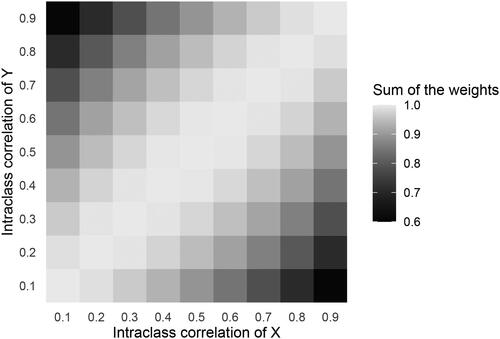
Figure 4. Solid (purple) lines represent the cross-sectional correlation plotted against intraclass correlation of X (i.e., ). Darkest line is for an intraclass correlation of Y (i.e.,
) of 0.1, while the lightest line represents the scenario when it is 0.9. Dashed (red) line represents the WP correlation ρW; dotted (blue) line represents the BP correlation ρB.

Table 2. Seven examples illustrating the relation between various correlations.