Figures & data
Figure 1. Multilevel dynamic structural equation model. (W) represents within-person estimates. Black dots indicate random effects. μ = Means. For simplicity, residual variances were not modeled as random.
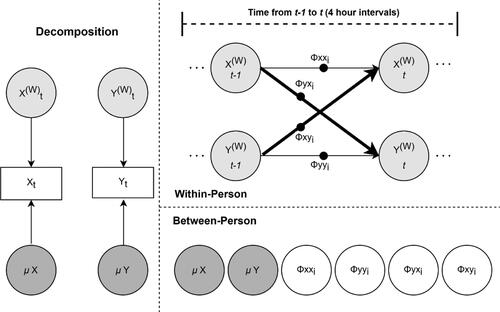
Figure 2. Mean scores of variables across time.
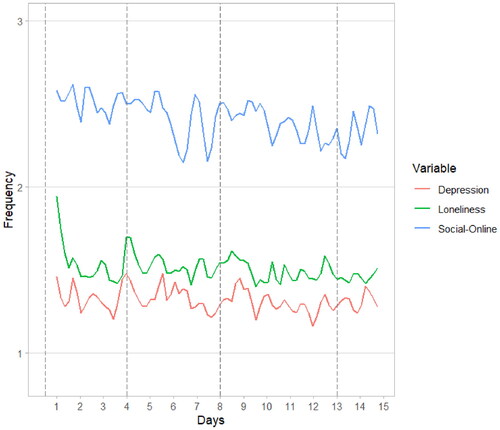
Figure 3. Raw scores of variables across time for three randomply selected participants.
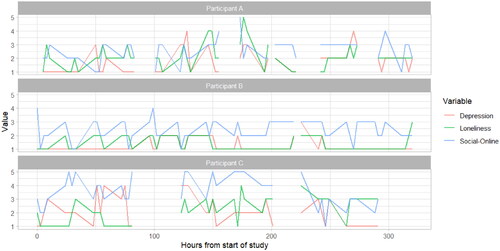
Figure 4. Multilevel dynamic structural equation model. (W) represents within-person estimates. Black dots indicate random effects. μ = Means, D = Depression, L = Loneliness, O = Time spent online using social media, Int = Interaction (L × O).
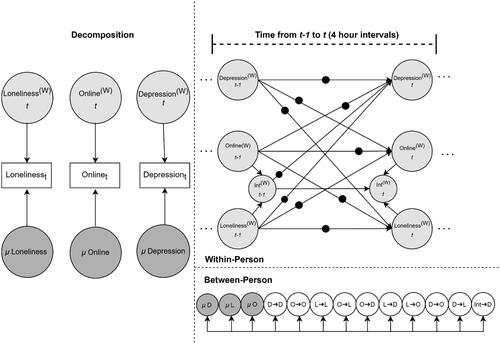
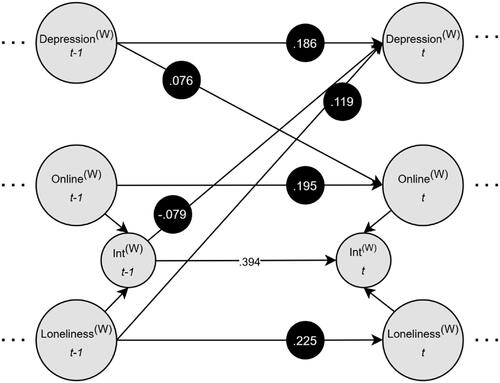
Figure 5. Multilevel dynamic structural equation model visualizing the within-person associations between loneliness, depression, and online social interactions. Nonsignificant paths, residual variances, co-variances, and factor variances are omitted for clarity. (W) represents within-person estimates. Black dots indicate random effects. μ = Means, D = Depression, L = Loneliness, O = Time spent online using social media.