
Figures & data
Figure 1. (a) Example of a network with four nodes 1, 2, 3 and 4 with associated variables
and
The edges
and
correspond to the conditional dependence statements, and the absence of edges correspond to conditional independence statements:
and
(b) The variable
is not part of the neighborhood of
while
and
are part of the neighborhood of
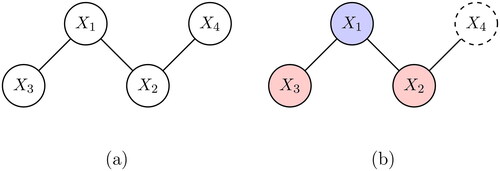
Figure 2. Top panel: bootstrapped sampling distributions of lasso estimates of partial correlations Bottom panel: the corresponding bootstrapped sampling distributions based on unbiased least squares estimates. The dashed vertical line indicates the true parameter.
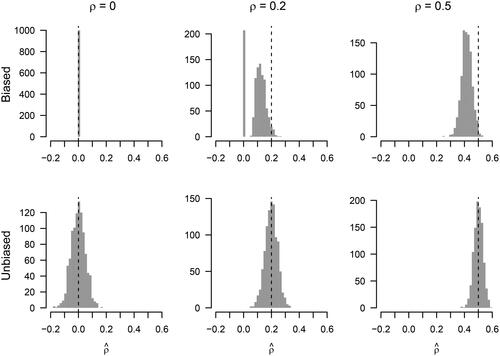
Figure 3. Sensitivity (first row), precision (second row), and coverage (third row) for edge probabilities 0.2 (left column) and 0.4 (right column), as a function of sample size (x-axis). The dashed horizontal line at 0.95 in the last row indicates the desired coverage based on the chosen threshold
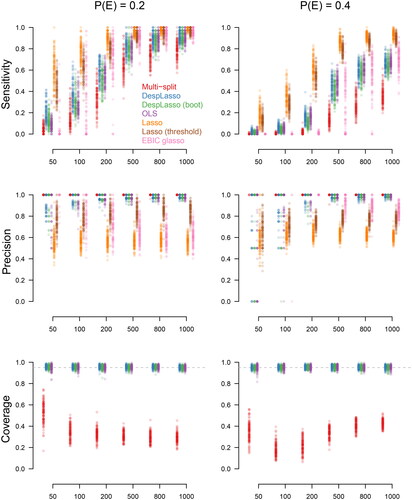
Figure 4. Significant partial correlations in the PTSD data; blue/red edges correspond to positive/negative partial correlations; the width of edges is a function of the absolute value of the associated parameter.
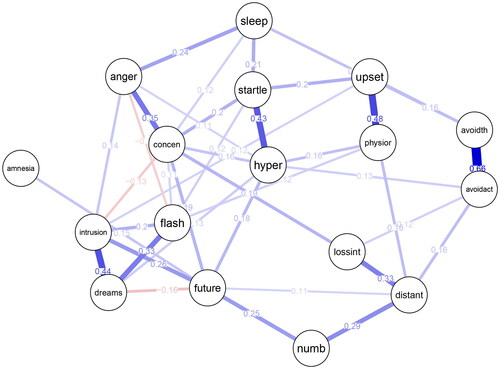
Figure 5. The point estimates and confidence intervals of the 50 partial correlations with the largest point estimate. Hollow points represent estimates whose CIs overlap with zero.
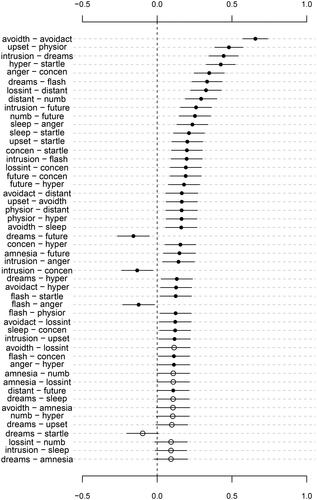
Figure I.1. Specificity (first row), coverage for absent edges (second row), and coverage for present edges (third row) for edge probabilities 0.2 (left column) and 0.4 (right column), as a function of sample size (x-axis).
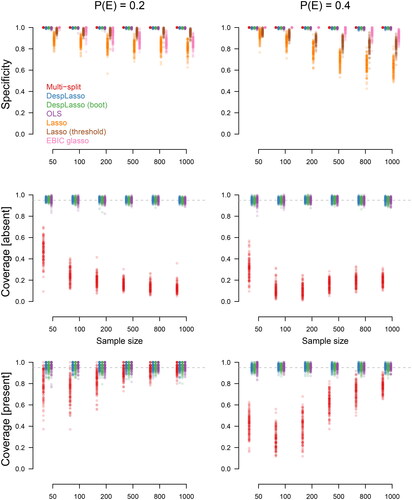
Table 1. The table provides an overview of the assumptions that are required for each of the three methods of obtaining p-values, the lasso, the graphical lasso (glasso) and OLS.
Table 2. Sparsity (for nodewise estimation) and beta-min violations for each of the settings in the simulation with probability of an edge or 0.4. Sparsity is in the second column for each number of observations (from 50 to 500) and
nodes. In the third and fourth columns, the number of nodes in the network that violate the sparsity assumption. In the fifth column, is the heuristic beta-min value for each of the number of observations. Sixth and seventh columns are the percentage of edges that violate the beta-min assumption (i.e., are smaller than the beta-min value).