
Figures & data
Figure 1. Hypothetical simplified state-specific measurement model for negative emotions. Here, individuals mentally represent “angry” and “sad” under one emotion category, which is represented by Factor 1 (F1). Due to high standardized loadings on F1, the items “angry” and “sad” can be considered to be weakly differentiated. The same logic applies to the items “scared” and “ashamed”, both of which have high loadings on Factor 2 (F2). Given the low correlation between F1 and F2, individuals differentiate between the categories “anger/sadness” versus “fear/shame.” For a continuous (slider) response format that ranges from 0 to 1, intercept values could theoretically range from 0.00 to 1.00. Hence, an intercept value of zero for “guilty” would indicate that individuals do not experience any guilt in this state. Grey, dashed arrows indicate low standardized cross-loadings. Item residuals are not depicted.
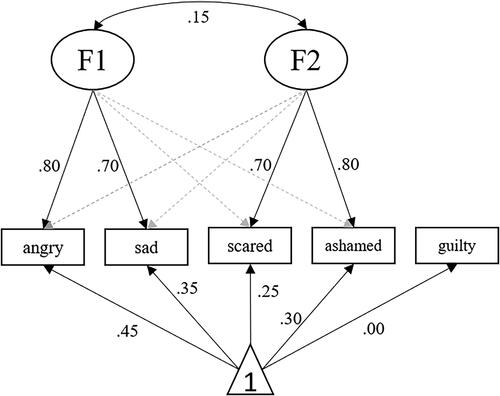
Table 1. State-specific measurement models for negative emotions.
Table 2. Stress-specific transition probabilities of latent negative EG states for an interval of 4 hr.
Figure 2. State-specific measurement models for negative emotions. The strengths of the loadings are absolute values of the standardized factor loadings. For interfactor correlations, see .
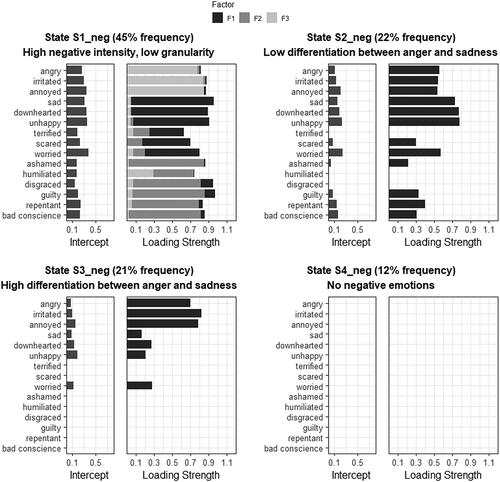
Table 3. Class-specific transition probabilities of latent negative EG states for an interval of 4 hr in mixture LMFA.
Figure 3. Predicting latent class membership from a neuroticism, b negative mood repair, and c positive mood maintenance for negative emotions. Class C1_neg represents the “variability in negative granularity” class, Class C2_neg the “high negative intensity, low granularity” class.
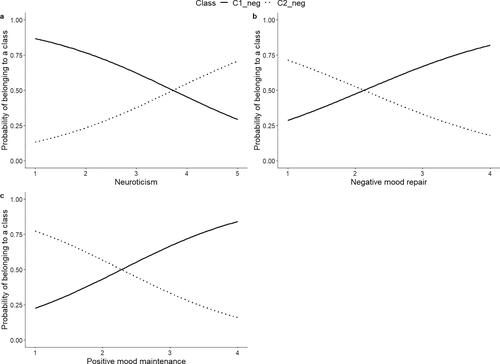
Table 4. Multinomial logistic regression parameters of latent classes regarding transitions between negative EG states predicted by time-constant covariates.
Supplemental Material
Download PDF (669.2 KB)Data availability statement
Data, analysis scripts, and model outputs for this research can be accessed via https://osf.io/w4tye/.