

Figures & data
Figure 1. Simulated mediation model; Up = binary latent class indicators; X = latent class exposure; M = binary manifest mediator; Y = binary manifest outcome.
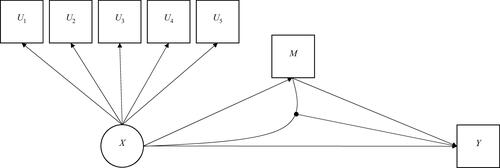
Table 1. Data used for simulation (sample = 5,000).
Table 2. Values for direct and indirect effects based on simulated data in Table 1.
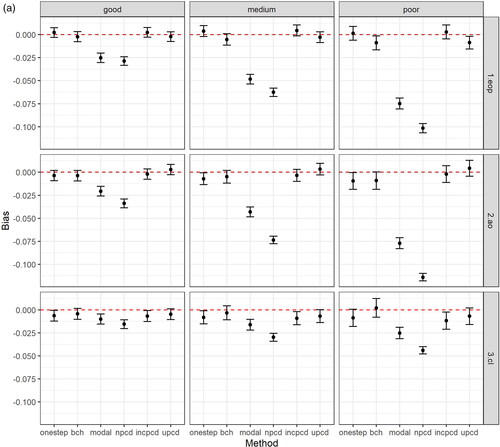

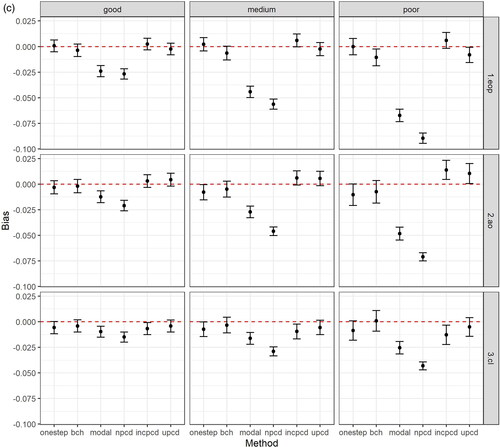
Table 3. Performance measures (Monte Carlo standard errors) for each method and data generating mechanism for the total effect (TE) of Early-Onset Persistent versus Low conduct problems (true value = 0.357); N = 457 simulated datasets with good entropy (0.9), N = 434 simulated datasets with medium entropy (0.8), N = 424 simulated datasets with poor entropy (0.7).
Table 4. Performance measures (Monte Carlo standard errors) for each method and data generating mechanism for the total natural indirect effect (TNIE) of Early-Onset Persistent versus Low conduct problems (true value = 0.057); N = 457 simulated datasets with good entropy (0.9), N = 434 simulated datasets with medium entropy (0.8), N = 424 simulated datasets with poor entropy (0.7).
Table 5. Performance measures (Monte Carlo standard errors) for each method and data generating mechanism for pure natural direct effect (PNDE) of Early-Onset Persistent versus Low conduct problems (true value = 0.300); N = 457 simulated datasets with good entropy (0.9), N = 434 simulated datasets with medium entropy (0.8), N = 424 simulated datasets with poor entropy (0.7).
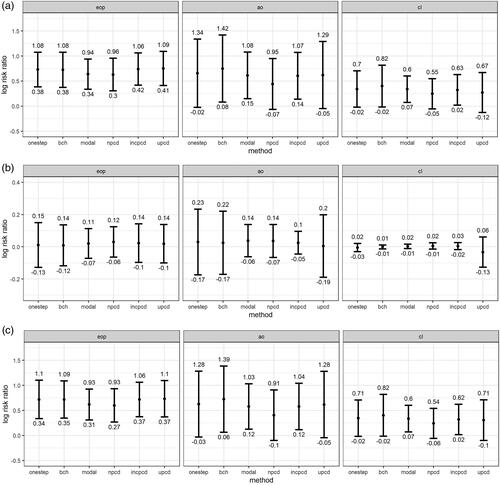
Figure 3. (a) Total effects (TE) for the applied example by method and class comparison; (b) Total natural indirect effects (TNIE) for the applied example by method and class comparison; (c) Pure natural direct effects (PNDE) for the applied example by method and class comparison; Effect estimates shown are log-risk ratios and 95% confidence intervals for each latent class (Early-Onset Persistent, Adolescent Onset, and Childhood Limited) versus the Low class, N = 3,039; Methods = one-step, bias-adjusted threestep (bch), modal class assignment (modal), non-inclusive PCDs (npcd), inclusive PCDs (incpcd), and updated PCDs (upcd); latent class comparisons = Early-Onset Persistent (eop) versus Low, Adolescent Onset (ao) versus Low; Childhood Limited (cl) versus Low.
Supplemental Material
Download Zip (1.6 MB)Data availability statement
The Mplus input files to create the simulated data that support the findings of this study are openly available in Github at https://github.com/gemmahammerton/latentclass-mediation. Access to ALSPAC data (used in the applied example) is through a system of managed open access (http://www.bristol.ac.uk/alspac/researchers/access/).