Figures & data
Figure 1. Three kinds of phenomena in psychological research. Intraindividual phenomena are statistical patterns that result from contrasting the individual’s current state with other time points. Interindividual phenomena result from contrasting the individual with other individuals. Combined phenomena are statistical patterns that result from a combination of both contrasts. Prototypical examples are listed in boxes.
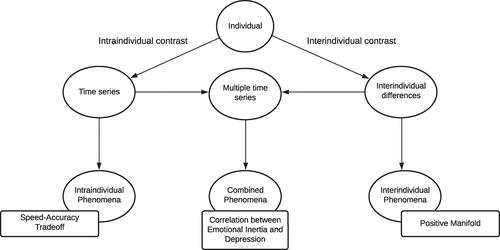
Figure 2. The causal diagram of the computational model of Panic Disorder by Robinaugh et al. (Citation2019). The components within the grey box are fast-changing processes at a time scale of minutes; the components outside are slow-changing processes on a time scale of days.
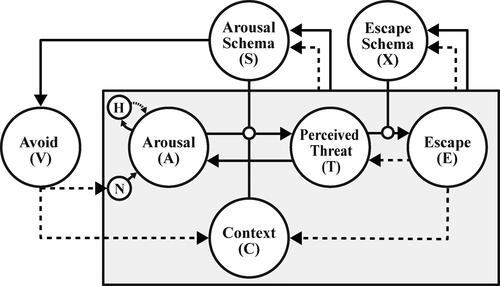
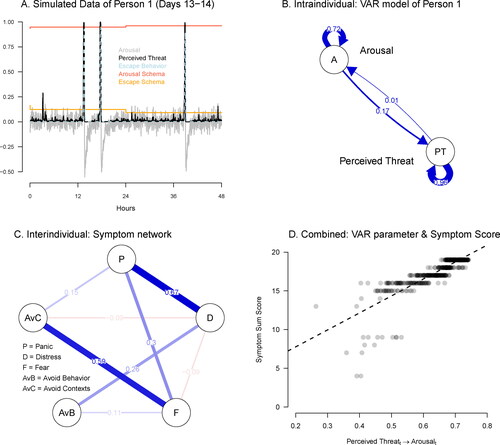
Figure 3. How the Panic Disorder model implies different types of phenomena. (a) Simulated data from days 14 and 15 of Person 1; we display the variables Arousal, Perceived Threat, Escape Behavior, Arousal Schema and Escape Schema; (b) A VAR model fitted to the Arousal (A) and Perceived Threat (PT) values measured at a minute time scale from Person 1; (c) Partial correlations between five symptoms, estimated based on a cross-sectional dataset consisting of the 500 simulated individuals; (d) The bivariate distribution of the lagged effect of PT on A and the symptom sum score in the last week in the sample of the 500 simulated individuals.