
Figures & data
Figure 1. Emotion differentiation across age. The blue line is a representation of the best fit obtained by using local polynomial regression fitting, and the gray area represents the corresponding 95% confidence interval.
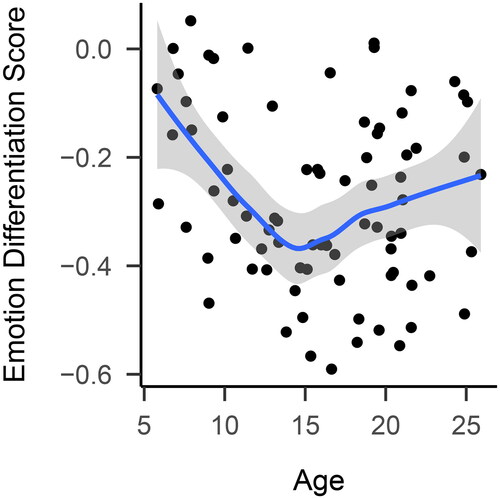
Figure 2. Visualization of investigated relationships.
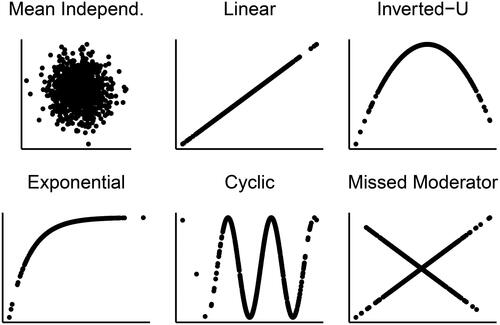
Table 1. Type I error rates.
Table 2. Maximum power lost compared to Pearson’s test.
Figure 3. Power comparisons between Pearson’s test and the distance correlation, and HHG-Pearson tests. Neg. Exp.: negative exponential; Missed Mod.: missed moderator; Mean Indep.: mean independence.
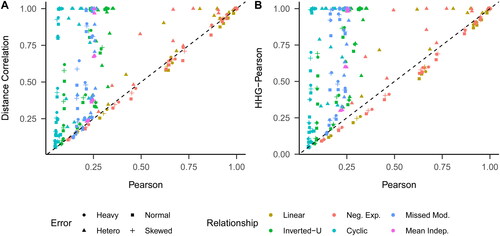
Table 3. Pairwise power comparisons.
Figure 4. Power comparison between Kendall’s and Spearman’s tests, and the distance correlation and HHG-Pearson tests. Neg. Exp.: negative exponential; Missed Mod.: missed moderator; Mean Indep.: mean independence.
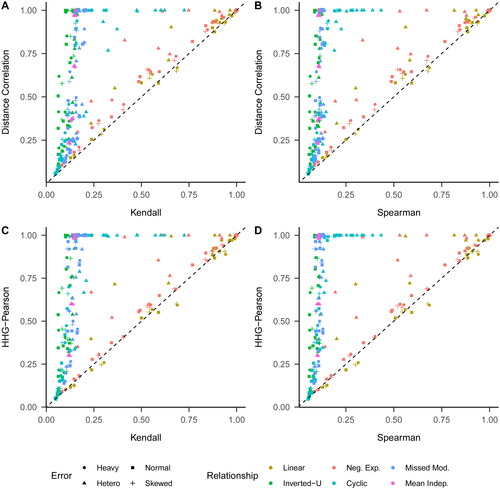
Figure 5. Power comparison between the distance correlation and HHG-Pearson tests. Neg. Exp.: negative exponential; Missed Mod.: missed moderator; Mean Indep.: mean independence.
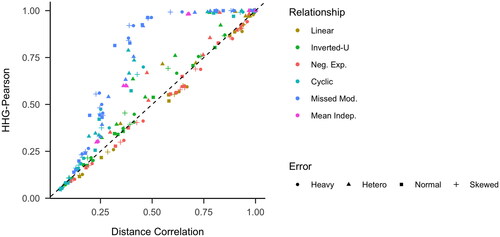
Table A1. Power.
Supplemental Material
Download PDF (147.3 KB)Data availability statement
The code to reproduce the simulation study and its analysis can be found here: https://osf.io/yketn/.