Figures & data
Figure 1. Colony morphology and conidial nuclear status of Epichloë hybrida. A–C. Plate colony morphologies. A. E. hybrida Lp1. B. E. festucae var. lolii AR5. C. E. typhina E8. D–E. Microscopy of E. hybrida Lp1. D. A conidiogenous cell. E. A DAPI (4′,6-diamidino-2-phenylindole)–stained conidium.
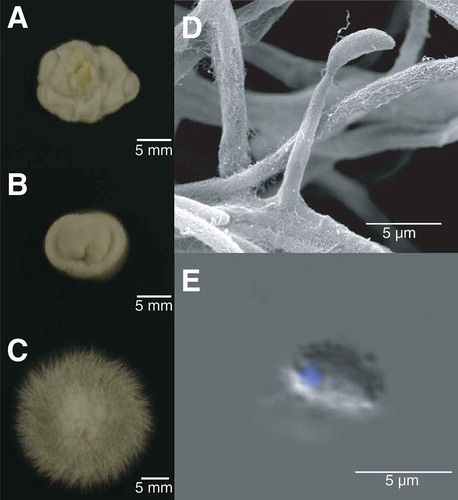
Table 1. Secondary metabolite chemical levels.
Figure 2. Phylogenetic placement of E. hybrida Lp1 and proxy parental species E. festucae var. lolii AR5 and E. typhina E8 in the Epichloë genus using actG, calM, tefA, and tubB gene sequences. Support values <1 are indicated at nodes, and sequence divergence is indicated by branch lengths according to the scale bar. Placements of the E. festucae–like and E. typhina–like homeologs from E. hybrida Lp1 are indicated in bold.
Figure 3. In planta differential expression bias. Gene expression differences between all orthologs (n = 8172 gene models), all homeologs (n = 7679), and ribosomal protein orthologs/homeologs (n = 105; KEGG KO03010). Genes were characterized as biased towards either E. festucae or E. typhina orthologs (parental species comparisons) or homeologs (E. hybrida comparisons), or not differentially expressed, and are plotted as the percent of all expressed genes (leftmost two columns). The same analysis for the ribosomal protein gene models is shown in the rightmost two columns.
Figure 4. Comparison of mitochondrial genomes from E. hybrida Lp1, E. typhina E8, and E. festucae var. lolii AR5. The E. hybrida Lp1 mitochondrial genome is shown with major features in track A. Features are color coded by RNA (blue), open reading frames and other nonintron features (orange), protein-coding gene regions (red), introns (gray), and intergenic regions (white). Features on the minus strand are indicated with “-” beside the feature name, e.g., “orf-.” The five protein-coding genes that differ in intron composition between E. hybrida Lp1 and E. typhina E8 are shown on track B. E. festucae var. lolii AR5 has exactly the same structure as E. hybrida Lp1 and so is not shown separately. Tracks C, D, and E show SNPs with a shared state in two of the species but distinct from the third. Track C, E. hybrida/E. festucae different in state from E. typhina; Track D, E. hybrida/E. typhina different in state from E. festucae; and Track E, E. festucae/E. typhina different in state from E. hybrida.
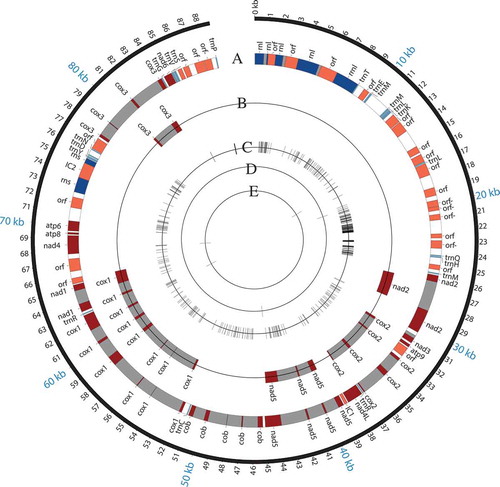
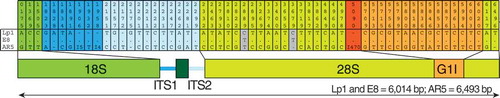
Figure 5. Epichloë hybrida Lp1 rDNA sequence derives from E. typhina. The 56 positions in the rDNA in E. festucae AR5/E. typhina E8 that differ from the E. hybrida sequence are indicated. Shading corresponds to the rDNA coding region schematic shown underneath (to scale). Numbers above represent positions in the three-way alignment. Polymorphisms between E. hybrida Lp1 and E. typhina E8 are shown in gray; one (position 2889) is likely a mutation in the E. hybrida lineage and the other (position 3679) is likely a mutation in the E. typhina lineage. Three polymorphisms, indicated by “I” and the number of nucleotides involved, are multinucleotide indels. The 470-bp indel starting at position 5090 (red) is a group I intron that has inserted in the E. festucae var. lolii AR5 28S rRNA gene near another group I intron (G1I, orange) that is shared between all three species. The 5.8S rRNA gene (dark green box in the schema) has no polymorphisms. The majority of the polymorphisms (35 of 58) are found in the noncoding regions (ITS1, ITS2 and group I intron). The lengths of the rRNA coding regions from the three species are shown at the bottom.