Figures & data
Table 1. Summary of information and statistics for the analyzed section Alternaria genomes
Figure 1. Circular plots showing macrosynteny between section Alternaria genomes sequenced with long-read technology. Four genomes were compared with the NAP07 genome. NAP07 chromosomes are color-coded and shown on the right side of each plot. Scaffolds from other genomes are in black and shown on the left side of each plot. Tick marks along chromosomes/scaffolds indicate 1 Mb distances
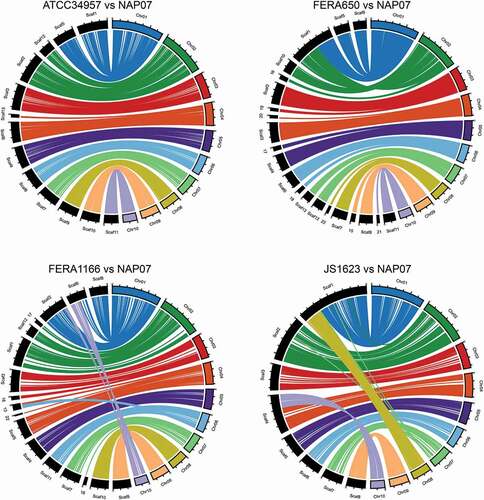
Figure 2. Maximum likelihood tree constructed from the custom data set of 6209 genes concatenated. Shading of squares at nodes represents the level of support each node received from bootstrapping, but also from other data sets or analyses methods (see inset). For shading, black indicates that the branch was present and significantly supported, gray indicates that the branch was present but not significantly supported, and white indicates that the branch was absent. Significant support was considered >95% in ML ultrafast bootstrapping for the BUSCO and custom data sets, >95% in posterior probability for the custom MSC data set, and presence in consenses tree for OrthoFinder data set. Numbers on branches indicate the gene concordance factor (GCF) for the 6209 genes trees compared with the displayed species tree. Current species name is indicated in brackets in taxon labels, if different from original species name. T indicates ex-type strain
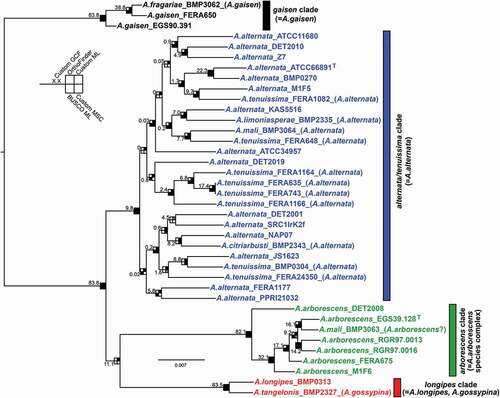
Figure 3. Plots of branch-specific concordance factor as a function of genomic location. Lines represent moving averages based on a sliding window of 20 genes. A concordance factor of 100 indicates that the branch was present in all included gene trees, whereas 0 indicates that the branch was absent in all included gene trees. The mean for the entire chromosome is indicated within each panel
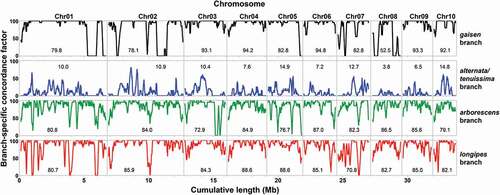
Table 2. List of 20 candidate genes that are diagnostic for the four analyzed clades in section Alternaria
Table 3. Existing markers and their ability to discriminate the four analyzed clades in section Alternaria.
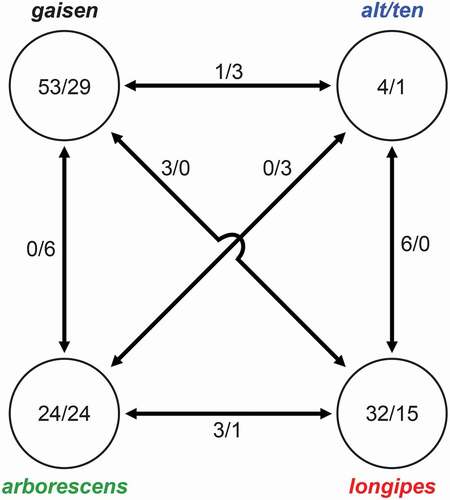
Figure 4. Numbers of orthogroups that were clade specific (present/absent). Numbers within circles indicate orthogroup patterns for single clades (e.g., present in all taxa in clade but absent from all other taxa/absent from all taxa in clade but present in all other taxa). Numbers between circles indicate orthogroup patterns shared between two clades