Figures & data
Table 1. Primers used for PCR amplification and sequencing portions of four genes comprising six marker loci.
Figure 1. Phylogenetic tree of 16 representative Fusarium isolates from Kazakhstan (in bold red) and 51 related reference strains of various Fusarium species. The 50% majority rule consensus phylogram was inferred from Bayesian analysis of the combined data set of six loci (TEF1, CaM, RPB1 A–C, RPB1 D–G, RPB2 5–7, and RPB2 7–11). Bayesian posterior probabilities (≥0.90) and ML bootstrap support (≥70) are shown before and after slashes, respectively. Scale bar indicates 0.1 expected changes per site.
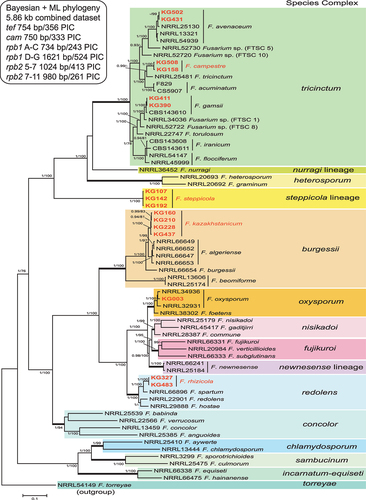
Figure 2. Maximum likelihood phylogenetic tree of representative isolates of Fusarium burgessii species complex. Isolates of the novel species from Kazakhstan, F. kazakhstanicum, are shown in bold. RAxML analysis was conducted on combined data set of six loci (TEF1, CaM, RPB1 A–C, RPB1 D–G, RPB2 5–7, and RPB2 7–11). Bayesian posterior probabilities (≥0.90) and ML bootstrap support (≥70) are shown before and after slashes, respectively. Scale bar indicates 0.01 expected changes per site.
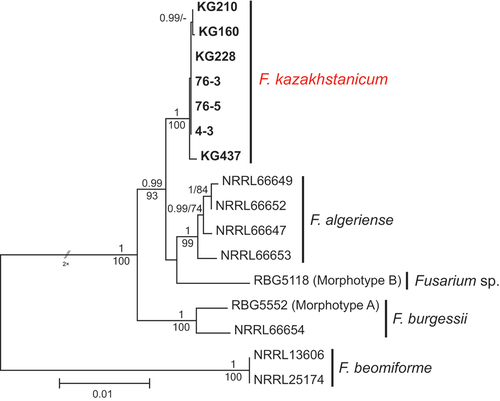
Figure 3. Fusarium kazakhstanicum. A–H. Colony morphology after 8 d growth on PDA using a 12/12 h photoperiod. Colony surface is shown on left half of each plate and colony undersurface on right half. A. KG159. B. KG160. C. KG210. D. KG211. E. KG228. F. KG231. G. KG232. H. KG437. I–P. KG160. I–J. Sporodochia on carnation leaf. K. Aerial conidia formed on monophialides. L, P. Microconidia in false heads on monophialides. M. 0–3-septate aerial conidia. N. Chlamydospores. O. Fusiform, mostly 3-septate sporodochial conidia. Bars: I = 1 mm; J–P = 20 μm.
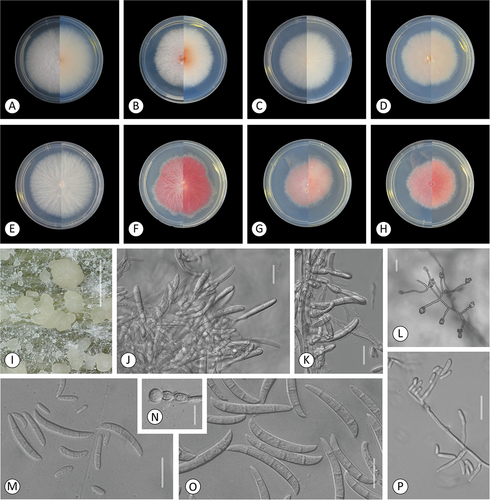
Figure 4. Fusarium rhizicola. A–B. Colony morphology after 8 d growth on PDA using a 12/12 h photoperiod. Colony surface is shown on left half of each plate and colony undersurface on right half. A. KG327. B. KG483. C. Sporodochia of KG327 formed on carnation leaf. D–H. KG483. D. 0-septate and multiseptate aerial conidia. E–F. Microconidia in false heads on monophialides. G–H. Aerial conidia developed on monophialides. Bars: C = 1 mm; D–H =20 μm.
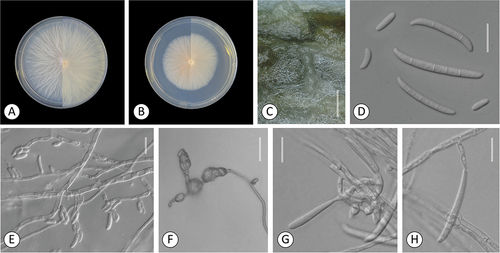
Figure 5. Fusarium campestre (FTSC 12). A–B. Colony morphology after 8 d growth on PDA using a 12/12 h photoperiod. Colony surface is shown on left half of each plate and colony undersurface on right half. A. KG158. B. KG508. C-G. KG158. C. Sporodochia on carnation leaf. D. Microconidia in false head on a long conidiophore. E. Conidiophores producing citriform microconidia. F. Multiseptate fusiform sporodochial conidia. G. 0- to 1-septate and multiseptate aerial and sporodochial conidia, respectively. Bars: C = 1 mm; D–G = 20 μm.
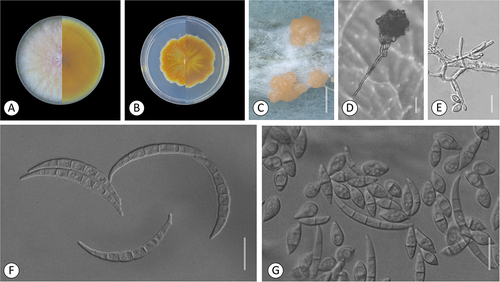
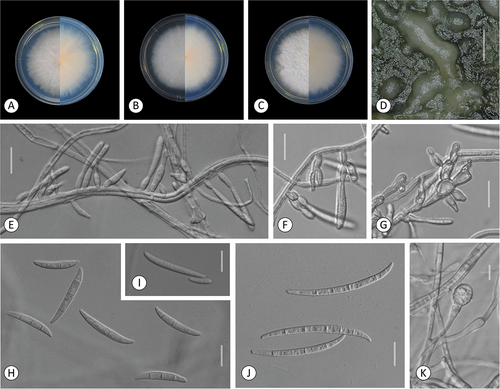
Figure 6. Fusarium steppicola. A–C. Colony morphology after 8 d growth on PDA using a 12/12 h photoperiod. Colony surface shown on left half of each plate and colony undersurface on right half. A. KG107. B. KG142. C. KG192. D–K. KG160. D. Sporodochia formed on carnation leaf. E–G. Aerial conidia formed on monophialides. H–I. Fusiform multiseptate aerial conidia. J. Fusiform multiseptate sporodochial conidia. K. Terminal chlamydospore. Bars: D = 0.5 mm; E–K =20 μm.