Figures & data
Figure 1. Map showing the four major geographic sampling locations in Eurasia and their trichothecene genotype frequencies: Norway (highlighted yellow), Finland and northwestern Russia (highlighted pink), southwestern Russia (highlighted blue), and Siberia and the Russian Far East (highlighted green).
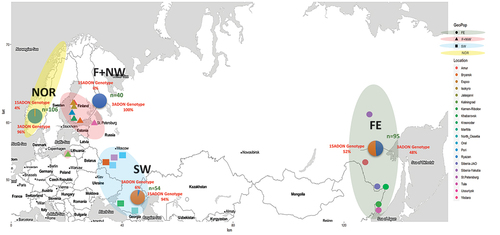
Table 1. Genetic differentiation, trichothecene genotype composition, and genetic diversity for four groups of Eurasian isolates defined by sampling location: Finland and northwestern Russia (F+NW), southwestern and western Russia (SW), the Russian Far East (FE), and Norway (NOR).
Figure 2. Bayesian analyses of population structure and admixture based on VNTR data for a total of 296 isolates from Finland and northwestern Russia (F+NW), western and southwestern Russia (SW), Siberia and the Russian Far East (FE), and Norway (NOR). Colored bars indicate Bayesian estimates of ancestry (q) for each isolate in simulations with 2 to 5 genetic clusters (K).
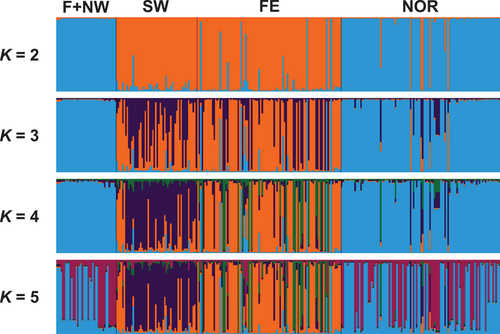
Table 2. Genetic differentiation, trichothecene genotype composition, and genetic diversity for four genetic populations from Eurasia (E1 and E2) and North America (NA1 and NA2).
Figure 3. Bayesian analyses of population structure and admixture based on VNTR data for a total of 534 isolates from four previously defined genetic populations (E1, E2, NA1, and NA2) from Finland and northwestern Russia (F+NW), western and southwestern Russia (SW), Siberia and the Russian Far East (FE), Norway (NOR), and the USA and Canada. Bayesian estimates of ancestry (q) were determined in simulations with 1 to 5 genetic clusters (K). Colored bars reflect individual q value assignments for each isolate derived from a model with three genetic clusters (K = 3), which was identified as the optimal model in that it produced the greatest rate of change in likelihood values between successive values of K.
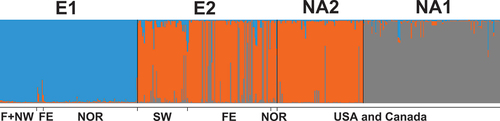
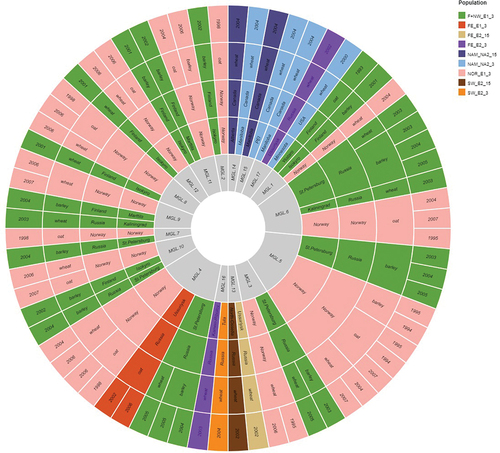
Figure 4. Graph showing shared multilocus genotypes inferred from a clone corrected data set consisting of one individual per MLG represented per population based on VNTR profile, sampling year, chemotype, host, genetic population (E1, E2, NA1, NA2), and location. Seventeen shared MLGs were identified on this basis.