Figures & data
Figure 1. Results of detrended correspondence analysis (DCA) visualizing differences in the concentration of 34 fatty acids in sporocarps of 10 mushrooms species from particular sites and plots. Points represent samples of mushroom species from a particular plot and site. Different symbols represent particular mushroom species collected at different sites: Am = Armillaria mellea; Lv = Lactarius vellereus; Lp = Lycoperdon perlatum; Mp = Macrolepiota procera; Rb = Rhodocollybia butyracea; Rn = Russula nigrescens; Rc = Russula cyanoxantha; Xch = Xerocomellus chrysenteron; Ll = Laccaria laccata; Lpr = Laccaria proxima). Sites: B = Białowieża (Poland); Z = Zedelgem (Belgium); K = Kaltenborn (Germany). Black arrows show the passive projection of soil and tree stand characteristics correlated with DCA result: canopy_cov = canopy cover; C_N = carbon to nitrogen ratio; DeciProp = deciduous trees proportion; tree_rich = tree species richness; Nconc = Nitrogen concentration; understory_cov = understory cover.
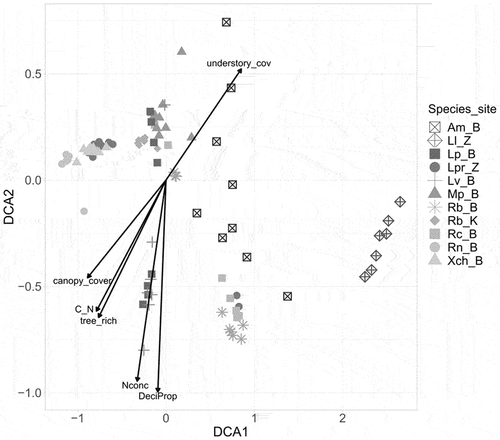
Table 1. Environmental factors explaining differences in the composition of 34 fatty acids in sporocarps of 10 mushroom species collected in Białowieża Primeval Forest (eastern Poland), Kaltenborn (central Germany), and Zedelgem (northeastern Belgium).
Table 2. Linear models explaining concentration of fatty acids (ALL FA, SFA, PUFA, MUFA; µg/100 g dry mass) in sporocarps of 10 mushroom species collected in Białowieża Primeval Forest (eastern Poland), Kaltenborn (central Germany), and Zedelgem (northeastern Belgium).
Figure 2. Partial regression plots visualizing mean (+ SE) differences in the concentration of five groups of fatty acids (ALL FA = all fatty acids; SFA = saturated fatty acids; PUFA = polyunsaturated fatty acids; MUFA = monounsaturated fatty acids; UFA = unsaturated fatty acids [PUFA = MUFA]; µg/100 g dry mass) between 10 mushroom species collected at different sites: Am = Armillaria mellea; Lv = Lactarius vellereus; Lp = Lycoperdon perlatum; Mp = Macrolepiota procera; Rb = Rhodocollybia butyracea; Rn = Russula nigrescens; Rc = Russula cyanoxantha; Xch = Xerocomellus chrysenteron; Ll = Laccaria laccata; Lpr = Laccaria proxima). Sites: B = Białowieża (Poland); Z = Zedelgem (Belgium); K = Kaltenborn (Germany). Groups marked by the same letter do not differ significantly at P = 0.05, according to pairwise comparisons of least-squares means (lsmeans::cld). For the remaining partial regression plots visualizing influence of soil and tree stand characteristics on the concentration of groups of FA in sporocarps, see and SUPPLEMENTARY FIGS. 1 and 2.
![Figure 2. Partial regression plots visualizing mean (+ SE) differences in the concentration of five groups of fatty acids (ALL FA = all fatty acids; SFA = saturated fatty acids; PUFA = polyunsaturated fatty acids; MUFA = monounsaturated fatty acids; UFA = unsaturated fatty acids [PUFA = MUFA]; µg/100 g dry mass) between 10 mushroom species collected at different sites: Am = Armillaria mellea; Lv = Lactarius vellereus; Lp = Lycoperdon perlatum; Mp = Macrolepiota procera; Rb = Rhodocollybia butyracea; Rn = Russula nigrescens; Rc = Russula cyanoxantha; Xch = Xerocomellus chrysenteron; Ll = Laccaria laccata; Lpr = Laccaria proxima). Sites: B = Białowieża (Poland); Z = Zedelgem (Belgium); K = Kaltenborn (Germany). Groups marked by the same letter do not differ significantly at P = 0.05, according to pairwise comparisons of least-squares means (lsmeans::cld). For the remaining partial regression plots visualizing influence of soil and tree stand characteristics on the concentration of groups of FA in sporocarps, see FIGS. 3–5 and SUPPLEMENTARY FIGS. 1 and 2.](/cms/asset/a2d0c497-7e0b-4346-bd22-879f7f1c9423/umyc_a_2325045_f0002_b.gif)
Figure 3. Partial regression plots visualizing influence of soil and tree stand characteristics on the concentration of all fatty acids (ALL FA; µg/100 g dry mass) in sporocarps of Armillaria mellea, Lactarius vellereus, Lycoperdon perlatum, Macrolepiota procera, Rhodocollybia butyracea, Russula nigrescens, Russula cyanoxantha, Xerocomellus chrysenteron, Laccaria laccata, and Laccaria proxima collected in Białowieża (Poland), Zedelgem (Belgium), and Kaltenborn (Germany). For partial regression plots showing mean (+ SE) differences in the content of fatty acids among fungi species, see .
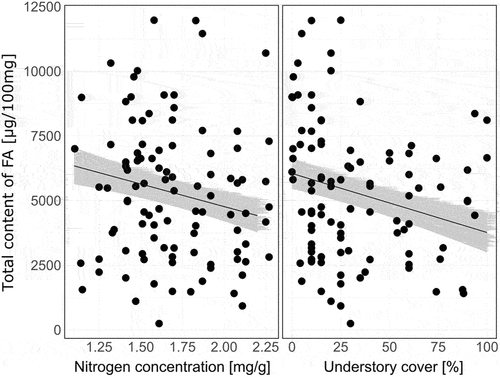
Figure 4. Partial regression plots visualizing influence of soil and tree stand characteristics on the concentration of saturated fatty acids (SFA; µg/100 g dry mass) in sporocarps of Armillaria mellea, Lactarius vellereus, Lycoperdon perlatum, Macrolepiota procera, Rhodocollybia butyracea, Russula nigrescens, Russula cyanoxantha, Xerocomellus chrysenteron, Laccaria laccata, and Laccaria proxima collected in Białowieża (Poland), Zedelgem (Belgium), and Kaltenborn (Germany). For partial regression plots showing mean (+ SE) differences in the content of fatty acids among fungi species, see .
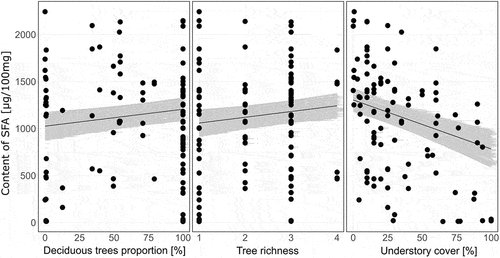
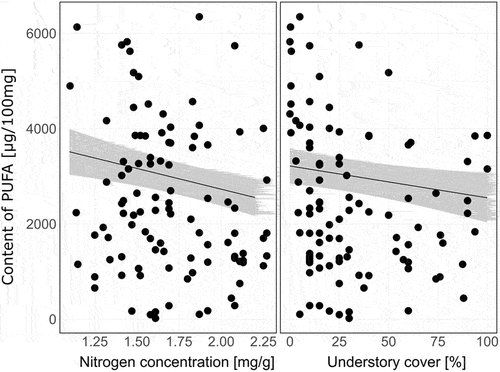
Figure 5. Partial regression plots visualizing influence of soil and tree stand characteristics on the concentration of polyunsaturated fatty acids (PUFA; µg/100 g dry mass) in sporocarps of Armillaria mellea, Lactarius vellereus, Lycoperdon perlatum, Macrolepiota procera, Rhodocollybia butyracea, Russula nigrescens, Russula cyanoxantha, Xerocomellus chrysenteron, Laccaria laccata, and Laccaria proxima collected in Białowieża (Poland), Zedelgem (Belgium), and Kaltenborn (Germany). For partial regression plots showing mean (+ SE) differences in the content of fatty acids among fungi species, see .