Figures & data
Figure 1. Chasmothecial appendage morphology of Erysipheae. a. Circinate (Erysiphe carpini-laxiflorae). b. Branched (E. berchemiae). c. Clavate (E. japonica). d. Mycelioid (E. glycines). Bars = 100 μm.
Figure 2. State transitions of (a) host types and (b) appendage morphologies. Transitions with z-scores ≥20% are indicated by dashed arrows, and those with z-scores <20% are indicated by thick arrows. Asterisks indicate the most ancestral state.
Figure 3. Ancestral state reconstruction of host types and appendage morphologies. Asterisks indicate posterior probabilities (PPs) of supported states at each node (≥0.90). The deciduous type is the most ancestral, whereas the herb (orange arrows) and evergreen (blue arrows) types evolved secondarily. The deciduous types (yellow-green arrows) reverted from herb types. The circinate type is the most ancestral, and the mycelioid (orange arrows), clavate, and branched (blue arrows) types evolved secondarily. The branched types (blue arrows) reverted from mycelioid types. Transitions of host type and appendage morphology at the same nodes are indicated (yellow stars).
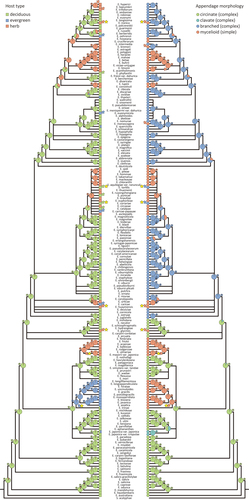
Table 1. Evolutionary correlations of host type and appendage morphology.
Figure 4. Number of combinations of host type and appendage morphology. The numbers of the present state are shown on the left, and the numbers of the ancestral state are shown on the right (PP ≥0.90).
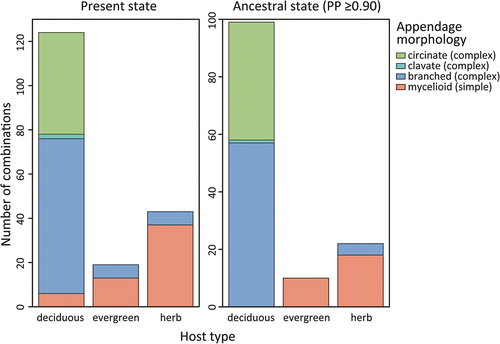
Figure 5. Contingent evolution of host type and appendage morphology. The transition from (1, 0) to (1, 1) is not indicated owing to the z-score being ≥70%. Asterisk indicates the most ancestral state.