174
Views
0
CrossRef citations to date
0
Altmetric
Research Article

Alternaria sections Infectoriae and Pseudoalternaria: New genomic resources, phylogenomic analyses, and biodiversity

&
Received 12 Feb 2024, Accepted 08 May 2024, Published online: 17 Jun 2024

Figures & data

Table 1. Information on fungal strains and newly generated genome assemblies.

Figure 1. Maximum likelihood tree constructed from the Custom gene data set of 5294 genes combined. Bold taxon names indicate newly generated genome assemblies. Main lineages are color-coded and labeled within. Shading of squares at nodes represents the level of support each node received from four different methods of phylogenetic analysis (see inset). Support was considered significant where the analysis found ≥70% in ML bootstrapping for the Custom (Custom ML) and BUSCO (BUSCO ML) data sets or ≥0.95 posterior probability for the multispecies coalescent (Custom MSC) analysis. For shading, black indicates the branch was significantly supported, gray indicates the branch was present but not significantly supported, and white indicates the branch was absent. For shading of gene concordance factor (Custom GCF) analysis, black indicates the branch had a GCF ≥50, gray indicates GCF between 50 and 25, and white indicates GCF ≤25. The actual length of the branch leading to A. panax (outgroup) is 5× as long as shown. Previously existing species designations are shown in brackets. “T” indicates ex-type strains. Dashed-line boxes contain strains that should be the same ex-type strain.

Figure 1. Maximum likelihood tree constructed from the Custom gene data set of 5294 genes combined. Bold taxon names indicate newly generated genome assemblies. Main lineages are color-coded and labeled within. Shading of squares at nodes represents the level of support each node received from four different methods of phylogenetic analysis (see inset). Support was considered significant where the analysis found ≥70% in ML bootstrapping for the Custom (Custom ML) and BUSCO (BUSCO ML) data sets or ≥0.95 posterior probability for the multispecies coalescent (Custom MSC) analysis. For shading, black indicates the branch was significantly supported, gray indicates the branch was present but not significantly supported, and white indicates the branch was absent. For shading of gene concordance factor (Custom GCF) analysis, black indicates the branch had a GCF ≥50, gray indicates GCF between 50 and 25, and white indicates GCF ≤25. The actual length of the branch leading to A. panax (outgroup) is 5× as long as shown. Previously existing species designations are shown in brackets. “T” indicates ex-type strains. Dashed-line boxes contain strains that should be the same ex-type strain.

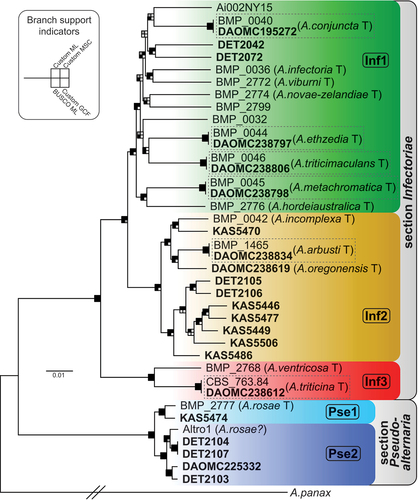
Table 2. Performance of standard molecular markers.

Figure 2. Maximum likelihood tree constructed from the ATPase and gapdh loci combined, including as many unique strains as possible (total = 110 section Infectoriae and Pseudoalternaria strains). ML bootstrapping percentages (branch support) are shown on major branches. Sections and lineages are color-coded to match the phylogenomic analyses. “T” indicates ex-type strains. Previous species designations are shown in taxon labels. Strains not identified to species are indicated as “sect.Inf” and “sect.Pse,” for section Infectoriae and section Pseudoalternaria, respectively.

Figure 2. Maximum likelihood tree constructed from the ATPase and gapdh loci combined, including as many unique strains as possible (total = 110 section Infectoriae and Pseudoalternaria strains). ML bootstrapping percentages (branch support) are shown on major branches. Sections and lineages are color-coded to match the phylogenomic analyses. “T” indicates ex-type strains. Previous species designations are shown in taxon labels. Strains not identified to species are indicated as “sect.Inf” and “sect.Pse,” for section Infectoriae and section Pseudoalternaria, respectively.

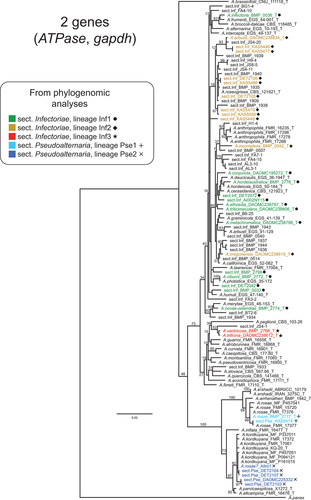
Table 3. List of eight candidate genes that are diagnostic for the sections and lineages.

Supplemental material

Supplementary_Material.pdf

Download PDF (793.2 KB)